

The focus of this report is to outline the problems and interesting features discovered in the COARE surface meteorological data during the VISIT stage of the QC process. Section 2 outlines the platforms and meteorological values evaluated with VISIT. A discussion of problems found, flagged, or corrected for each meteorological variable is found in section 3. Section 4 contains a summary statement of data quality and flag statistics for each of the platforms. These summaries are the final result of all three stages of the QC process.
| Table 1: List of independent meteorological data sets reviewed within the VISIT analysis for COARE. | ||
| Station Mounting | Platform Name/Type | Number of Independent Data Sets |
| Moored Buoy | ATLAS | 15 |
| PROTEUS | 2 | |
| VAWR/IMET | 1 | |
| Drifting Buoy | Marisonde | 4 |
| Niiler | 83 | |
| Land | CMAN | 7 |
| GTS | 79 | |
| ISS | 4 | |
| Research Vessel | ||
|---|---|---|
| AWS, Bridge | 2 |
| Bridge | 1 |
| ISS | 1 |
| AWS | 1 |
| Bridge | 1 |
| AWS | 1 |
| Bridge | 1 |
| ISS, Bridge | 2 |
| AWS | 1 |
| AWS | 1 |
| Bridge | 1 |
| Total | 208 | |
| Note: No surface meteorological data for the R/V Alis, Kaiyo, and Keifu Maru were ever made available to the DPC. Also, due to multiple data problems, the PSS data were not reviewed in VISIT. | ||
| |
| Flag | Definition |
| A | Original data had unknown units. The units shown were determined using a climatology or some other method. |
| B | Original data were out of the range bounds outlined. |
| C | Time data are not sequential or date/time not valid. |
| D | Data failed T„Tw„Td test. In the free atmosphere, the temperature is always greater than or equal to the wet-bulb temperature, which in turn is always greater than or equal to the dew point temperature. |
| E | Data failed resultant wind recomputation check. When the data set includes all variables required, a program recomputes the earth relative wind speed and direction and compares the computed values to the reported earth relative wind speed and direction. A failed test occurs when the wind direction difference is > 10š or the wind speed difference is > 5 m/s. |
| F | Platform velocity unrealistic. Determined with platform position data. |
| G | Data are > 4 standard deviations from the COADS climatological means (da Silva et al. 1994). Test applied only to pressure, temperature, sea temperature, relative humidity, and wind speed. |
| H | Discontinuity found in data. |
| I | Interesting feature found in data. More specific information on the feature is contained in the QC reports. Examples include: hurricanes, sharp sea water temperature gradients, strong convective events, etc. |
| J | Data are of poor quality by visual inspection, DO NOT USE. |
| K | Data suspect - USE WITH CAUTION - flag applied when the data look to have obvious errors, but no specific reason for the error can be determined. |
| L | Oceanographic platform passes over land. |
| M | Known instrument malfunction. |
| N | Inconsistent with neighboring station. |
| P | Position of platform or its movement are uncertain. Data should be used with caution. |
| Q | Data arrived at the DPC already flagged as questionable. |
| S | Spike in the data. Usually one or two sequential data values (sometimes up to four values) that are drastically out of the current data trend. Spikes occur for many reasons, including power surges, typographical errors, data logging problems, lightning strikes, etc. |
| T | Time duplicate. |
| V | Colocated data differ - use with caution. |
| Z | Data passed evaluation. |
Hourly data from the entire IOP were analyzed one variable at a time. Higher temporal resolution data were flagged when necessary. Pressure (P), temperature (T), dewpoint (TD), sea temperature (TS), wet-bulb temperature (TW), relative humidity (RH), earth relative wind speed (SPD), and earth relative wind direction (DIR) were quality controlled.
3(a). Pressure
Overall, the intercomparison of pressure data from the TOGA COARE IOP showed the pressure values to be in excellent condition. Aside from sensor malfunctions and other minor problems found during VIDAT processing, most of the data values were consistent with values from nearby reporting stations and platforms. The data from several stations, however, were noticeably problematic.
The atmospheric pressure values reported by Lae (WMO ID #94027) were very inconsistent with surrounding observing platforms. Less than ten values for pressure were reported during the IOP and of these, nearly all of them differed dramatically from nearby observations. The values from Lae were typically near 1025 mb while values at the nearby stations of Wewak (94004), Manus (94044), and Rabaul (94085) were below 1010 mb. The data were flagged with 'N' flags and these values should be used with extreme caution.
Atmospheric pressure data from the Vickers standard observations, Shiyan ISS, and Kexue ISS were noticed to be consistently lower than values from surrounding platforms. The difference in the pressures from surrounding observations for each ship was approximately 2 mb. After some investigation, it was concluded that the differences could be attributed to the height of the pressure sensors aboard each ship. It was confirmed that the height of the pressure sensor for the Kexue ISS data was 24 m which would account for the 2 mb difference between this and the sea level pressure. The height of the sensors aboard the Shiyan and Vickers were unavailable but a similar scenario is likely.
Data obtained from Kapingamarangi between December 9, 1992 and December 14, 1992 was extremely noisy when compared to nearby ISS stations. The values varied by several millibars over the space of a few minutes (see Figure 1). The general trends, however, were in agreement, and no explanation for the noise was available. These values were not flagged but the data from these days should be used with some caution.
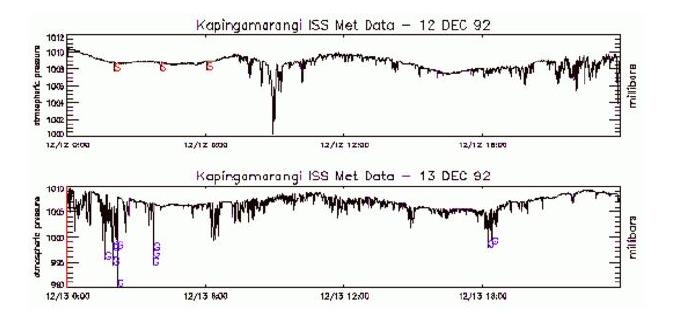
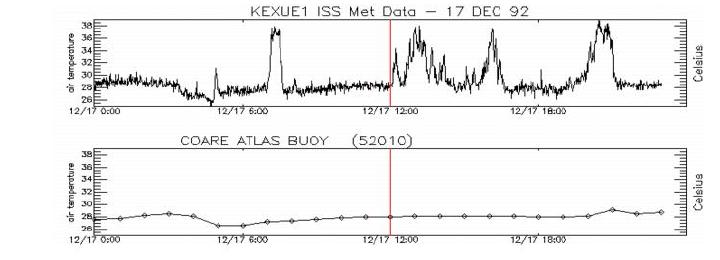
Table 3: Number of šF to šC conversions by station
| Station Name | Station ID | Number of šF to šC Conversions |
| Lukunor Atoll | 94339 | 2 |
| Ponape Island | 91348 | 1 |
| Jaluit Atoll/Jabor | 91369 | 1 |
| Majuro/Marshall Island | 91376 | 1 |
| Funafuti Intl Airport | 91643 | 1 |
| Padang/Tabing | 96163 | 2 |
| Biak/Mokmer | 97560 | 1 |
| TOTAL | 9 | |
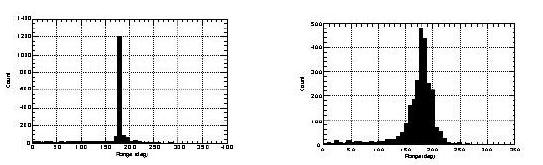
Two separate wind data sets were obtained from the Franklin. The research quality data included wind direction and speed from one sensor at 11.8 meters. The bridge observations from the Franklin included wind direction and speed from two different sensors, one at 10 meters and the other at 18 meters. During VISIT processing, it was observed that the research and bridge wind direction data differed dramatically. The difference between the directions appeared to be close to or exactly 180 degrees (Figure 3).
(a) (b)
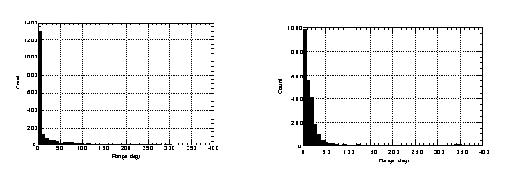
The wind directions for either the bridge or research data are incorrect by 180 degrees. Using VISIT, it was determined that the Franklin research quality wind direction data agreed with neighboring stations more so than the bridge data. Therefore, 180š were added to the wind directions from the bridge observations (at both the 10 m and 18 m heights). Revised difference histograms that include the modified bridge winds clearly show an improvement. The scatter shown in Figure 4b is most likely a function of recording winds at different sensor heights.
(a) (b)
3(d). Dewpoint
Aside from the problems found in VIDAT processing, the dewpoint data from the TOGA COARE IOP are in excellent condition. Nearly all of the data values are consistent with values from nearby reporting stations and platforms. Only a few "N" flags (Table 2) were added.
4. FLAG SUMMARIES
Buoys--WHOI | ||||
|---|---|---|---|---|
| Variable | Out of Bounds | Erroneous Data | Total Number of Flags | Percent of Variable Records Flagged |
| RH | 2 | 2 | 0.06 | |
| RR | 228 | 228 | 7.13 | |
| Total | 2 | 228 | 230 | |
| Percent of Total Data Flagged | 0.0063 | 0.7134 | 0.72 | |
Buoys--PMEL | |||||
|---|---|---|---|---|---|
Variable | > 4 S.D. From Climatological Mean | Suspect Data | Spike | Total Number of Flags | Percent of Variable Records Flagged |
| DIR | 171 | 171 | 0.39 | ||
| SPD | 10 | 171 | 181 | 0.41 | |
| T | 1 | 1 | 0.00* | ||
| TS | 50 | 5 | 55 | 0.13 | |
| Total | 11 | 392 | 5 | 408 | |
| Percent of Total Data Flagged | 0.0031 | 0.1120 | 0.0014 | 0.12 | |
The PMEL data are considered to be in good condition. The only significant problem occurred in the wind direction and wind speed of buoy 52011 and buoy 52012. Flags were added to these buoys when it was noticed that, on several different occasions the wind speed and direction remained constant for several hours at a time. Another minor problem occurred on buoy 52011 when it was noticed that on two occasions, the sea temperature data became somewhat erratic. These data were flagged as suspect.
Drifter--Marisonde | ||||
|---|---|---|---|---|
Variable | Unrealistic Platform Movement | Spike | Total Number of Flags | Percent of Variable Record Flagged |
| LAT | 4 | 4 | 0.09 | |
| LON | 4 | 4 | 0.09 | |
| SPD | 1 | 1 | 0.02 | |
| Total | 8 | 1 | 9 | |
| Percent of Total Data Flagged | 0.0244 | 0.0031 | 0.03 | |
Land--CMAN |
||||||
|---|---|---|---|---|---|---|
Variable | Interesting Feature | Erroneous Data | Spike | Colocation Error | Total Number of Flags | Percent of Variable Records Flagged |
| DIR | 2827 | 15 | 37 | 2879 | 14.68 | |
| SPD | 2827 | 16 | 35 | 2879 | 14.68 | |
| P | 1 | 2857 | 2858 | 14.57 | ||
| T | 1 | 2860 | 2928 | 14.93 | ||
| Total | 2 | 5654 | 99 | 5789 | 11544 | |
| Percent of Total Data Flagged | 0.0015 | 4.1183 | 0.0721 | 4.2166 | 8.41 | |
Land--GTS | ||||||||
|---|---|---|---|---|---|---|---|---|
Variable | Out of Bounds | Interesting Feature | Suspect Data | Intercom parison Problem | Spike | Colocati on Error | Total Number of Flags | Percent of Variable Records Flagged |
| DIR | 2 | 50 | 52 | 0.12 | ||||
| SPD | 4 | 33 | 24 | 61 | 0.14 | |||
| P | 15 | 1 | 21 | 60 | 969 | 1066 | 2.39 | |
| T | 2 | 1 | 20 | 65 | 952 | 1040 | 2.33 | |
| TD | 8 | 9 | 39 | 56 | 0.13 | |||
| Total | 10 | 19 | 2 | 50 | 199 | 1995 | 2275 | |
| Percent of Total Data Flagged | 0.0028 | 0.0053 | 0.0006 | 0.0140 | 0.0557 | 0.5581 | 0.64 | |
Land--Kapingamarangi ISS | ||||||||||
|---|---|---|---|---|---|---|---|---|---|---|
| Variable | Out of Bounds | >4S.D. From Climatological Mean | Interesting Feature | Erroneous Data | Suspect Data | Instrument Malfunction | Inter- com parison Error | Spike | Total Number of Flags | Percent of Variable Records Flagged |
| SPD | 15 | 15 | 0.01 | |||||||
| P | 1440 | 35 | 478 | 444 | 2397 | 1.40 | ||||
| T | 61 | 2 | 17 | 1595 | 966 | 343 | 2 | 2986 | 1.74 | |
| RH | 145 | 103626 | 235 | 5 | 104011 | 60.78 | ||||
| Total | 1501 | 35 | 2 | 17 | 2233 | 104592 | 578 | 451 | 109409 | |
| Percent of Total Data Flagged | 0.0975 | 0.0023 | 0.0001 | 0.0011 | 0.1450 | 6.7910 | 0.0375 | 0.0293 | 7.10 | |
Land--Kavieng ISS | ||||
|---|---|---|---|---|
| Variable | Interesting Feature | Instrument Malfunction | Total Number of Flags | Percent of Variable Records Flagged |
| DIR | 1 | 1 | 0.00* | |
| SPD | 1 | 1 | 0.00* | |
| P | 5728 | 5728 | 3.74 | |
| T | 10 | 10 | 0.01 | |
| RH | 10 | 10 | 0.01 | |
| Total | 22 | 5728 | 5750 | |
| Percent of Total Data Flagged | 0.0016 | 0.4151 | 0.42 | |
The data from the Kavieng ISS land station are considered to be in good condition. The only major problem occurred between 0000 UTC on November 1, 1992 and 2400 UTC on November 15, 1992, when a malfunctioning pressure sensor reported values of about 800 mb.
Land--Manus ISS | ||||
|---|---|---|---|---|
| Variable | Out of Bounds | Interesting Feature | Total Number of Flags | Percent of Variable Records Flagged |
| DIR | 2 | 2 | 0.00* | |
| SPD | 11 | 11 | 0.01 | |
| P | 1 | 1 | 0.00* | |
| T | 22 | 22 | 0.01 | |
| RH | 10440 | 12 | 10452 | 6.47 |
| Total | 10440 | 48 | ||
| Percent of Total Data Flagged | 0.7179 | 0.0033 | 10488 | 0.72 |
Land--Nauru ISS | |||||
|---|---|---|---|---|---|
| Variable | > 4 S.D. From Climatological Mean | Suspect Data | Spike | Total Number Flags | Percent of Variable Records Flagged |
| SPD | 1 | 1 | 0.00* | ||
| P | 1467 | 7 | 381 | 1855 | 1.10 |
| RH | 1 | 1 | 0.00* | ||
| Total | 1467 | 7 | 383 | 1857 | |
| Percent of Total Data Flagged | 0.0967 | 0.0005 | 0.0252 | 0.12 | |
The data from the Nauru ISS Land station are considered to be in good condition. The only major problems occurred in the pressure data, where rhythmic spikes occurred frequently. Also, a large number of pressure values were flagged as being greater than four standard deviations from the da Silva climatological mean (da Silva, et al. 1994) and should be used with caution.
Research Vessel--Xiangyanghong (BNTA) | ||||||||
|---|---|---|---|---|---|---|---|---|
| Variable | Units Added | Failed T„Tw„Td Test | Unrealistic Platform Movement | > 4 S.D. From Climatological Mean | Intercom parison Error | Time Duplicate | Total Number of Flags | Percent of Variable Records Flagged |
| TIME | 599 | 2 | 601 | 100.00 | ||||
| LAT | 596 | 5 | 601 | 100.00 | ||||
| LON | 596 | 5 | 601 | 100.00 | ||||
| DIR | 601 | 601 | 100.00 | |||||
| SPD | 597 | 4 | 601 | 100.00 | ||||
| P | 601 | 601 | 100.00 | |||||
| TD | 600 | 1 | 601 | 100.00 | ||||
| RH | 601 | 601 | 100.00 | |||||
| T | 600 | 1 | 601 | 100.00 | ||||
| TW | 600 | 1 | 601 | 100.00 | ||||
| TS | 600 | 1 | 601 | 100.00 | ||||
| Total | 6591 | 3 | 10 | 4 | 1 | 2 | 6611 | |
| Percent of Total Data Flagged | 99.6975 | 0.0454 | 0.1513 | 0.0605 | 0.0151 | 0.0303 | 100.00 | |
Research Vessel--Shiyan (BXMC) | |||||||
|---|---|---|---|---|---|---|---|
| Variable | Units Added | Unrealistic Platform Movement | > 4 S.D. From Climatological Mean | Spike | Time Duplicate | Total Number of Flags | Percent of Variable Record Flagged |
| TIME | 674 | 2 | 676 | 100.00 | |||
| LAT | 669 | 7 | 676 | 100.00 | |||
| LON | 669 | 7 | 676 | 100.00 | |||
| DIR | 676 | 676 | 100.00 | ||||
| SPD | 672 | 4 | 676 | 100.00 | |||
| P | 676 | 676 | 100.00 | ||||
| TD | 676 | 676 | 100.00 | ||||
| RH | 676 | 676 | 100.00 | ||||
| T | 676 | 676 | 100.00 | ||||
| TW | 676 | 676 | 100.00 | ||||
| TS | 675 | 1 | 676 | 100.00 | |||
| Total | 7415 | 14 | 4 | 1 | 2 | 7436 | |
| Percent of Total Data Flagged | 99.7176 | 0.1883 | 0.0538 | 0.0134 | 0.0269 | 100.00 | |
Research Vessel--Le Noroit (FITA) | ||||||
|---|---|---|---|---|---|---|
| Variable | Unrealistic Platform Movement | Suspect Data | Spike | Time Duplicate | Total Number of Flags | Percent of Variable Records Flagged |
| TIME | 2 | 2 | 0.34 | |||
| LAT | 3 | 3 | 0.51 | |||
| LON | 3 | 3 | 0.51 | |||
| DIR | 591 | 591 | 100.00 | |||
| SPD | 591 | 591 | 100.00 | |||
| P | 2 | 2 | 0.34 | |||
| TS | 1 | 1 | 0.17 | |||
| Total | 6 | 591 | 4 | 2 | 1193 | |
| Percent of Total Data Flagged | 0.1128 | 22.2222 | 0.0564 | 0.0376 | 22.43 | |
Research Vessel--Hakuho Maru (JDSS) | ||||
|---|---|---|---|---|
| Variable | Out of Bounds | > 4 S.D. From Climatological Mean | Total Number of Flags | Percent of Variable Records Flagged |
| PL_SPD | 49 | 49 | 2.43 | |
| SPD | 5 | 5 | 0.25 | |
| Total | 49 | 5 | 54 | |
| Percent of Total Data Flagged | 0.2025 | 0.0207 | 0.22 | |
Research Vessel--Franklin (VJJF)--Bridge Observations | |||
|---|---|---|---|
| Variable | > 4 S.D. From Climatological Mean | Total Number of Flags | Percent of Variable Records Flagged |
| SPD | 1 | 1 | 0.04 |
| Total | 1 | 1 | |
| Percent of Total Data Flagged | 0.0029 | 0.00* | |
Most of the data from the research vessel Franklin bridge observations are considered to be in excellent condition. The only problem was found in the wind direction data. After comparing the wind directions to the direction from the research data, a 180 degree difference was found between the two data sets. The directions were corrected by adding 180 degrees to all values (see section 3(c)). Through inspection, it was determined that the time stamps on this data set were in local time and not UTC. After investigation, the correct local time was determined and 10 hours were subtracted from the time stamps to set them to UTC. The time stamps are now correct.
Research Vessel--Franklin (VJJF)--Research Data | ||||||||
|---|---|---|---|---|---|---|---|---|
| Variable | Out of Bounds | Unrealistic Platform Movement | > 4 S.D. From Climatological Mean | Platform Crosses Land | Platform Position Uncertain | Spike | Total Number of Flags | Percent of Variable Records Flagged |
| LAT | 4 | 1 | 605 | 610 | 14.48 | |||
| LON | 4 | 1 | 605 | 610 | 14.48 | |||
| PL_SPD | 178 | 178 | 4.23 | |||||
| SPD | 1 | 1 | 0.02 | |||||
| TS | 2 | 2 | 0.05 | |||||
| TS2 | 3 | 21 | 24 | 0.57 | ||||
| Total | 181 | 8 | 22 | 2 | 1210 | 2 | 1425 | |
| Percent of Total Data Flagged | 0.3581 | 0.0158 | 0.0435 | 0.0040 | 2.3940 | 0.0040 | 2.82 | |
Research Vessel--Vickers (WTEC) | ||||||||
|---|---|---|---|---|---|---|---|---|
| Variable | Unrealistic Platform Movement | > 4 S.D. From the Climatological Mean | Erroneous Data | Platform Crosses Land | Intercom parison Error | Spike | Total Number of Flags | Percent of Variable Records Flagged |
| LAT | 82 | 1 | 83 | 0.29 | ||||
| LON | 82 | 1 | 83 | 0.29 | ||||
| PL_HD | 86 | 86 | 0.30 | |||||
| PL_SPD | 13 | 27 | 40 | 0.14 | ||||
| DIR | 38 | 38 | 0.13 | |||||
| SPD | 43 | 165 | 208 | 0.73 | ||||
| P | 249 | 249 | 0.88 | |||||
| T | 6 | 622 | 30 | 6 | 664 | 2.34 | ||
| TS | 148 | 66 | 214 | 0.76 | ||||
| RH | 750 | 48 | 798 | 2.82 | ||||
| Total | 164 | 197 | 1385 | 2 | 30 | 685 | 2463 | |
| Percent of Total Data Flagged | 0.0526 | 0.0632 | 0.4444 | 0.0006 | 0.0096 | 0.2198 | 0.79 | |
Research Vessel--Moana Wave (WUS9293) | |||||||
|---|---|---|---|---|---|---|---|
| Variable | Unrealistic Platform Movement | > 4 S.D. From Climatological Mean | Erroneous Data | Intercomp arison Error | Spike | Total Number of Flags | Percent of Variable Records Flagged |
| LAT | 24 | 24 | 0.30 | ||||
| LON | 24 | 24 | 0.30 | ||||
| PL_HD | 64 | 64 | 0.79 | ||||
| DIR | 3 | 3 | 0.04 | ||||
| SPD | 6 | 19 | 25 | 0.31 | |||
| T | 5 | 5 | 0.06 | ||||
| T2 | 1 | 9 | 10 | 0.12 | |||
| TS | 5 | 9 | 18 | 32 | 0.40 | ||
| Q | 3 | 3 | 0.04 | ||||
| Q2 | 3 | 3 | 0.04 | ||||
| Total | 48 | 7 | 5 | 9 | 124 | 193 | |
| Percent of Total Data Flagged | 0.0495 | 0.0072 | 0.0052 | 0.0093 | 0.1279 | 0.20 | |
Research Vessel--Kexue (BCCU) | |||||||||||
|---|---|---|---|---|---|---|---|---|---|---|---|
| Variable | Out of Bounds | Unrealistic Platform Movement | >4S.D. From Climato log- ical Mean | Erroneous Data | Suspect Data | Platform Crosses Land | Inter comparison Error | Platform Position Uncertain | Spike | Total Number of Flags | Percent of Variable Records Flagged |
| LAT | 591 | 30 | 161 | 782 | 0.63 | ||||||
| LON | 591 | 30 | 161 | 782 | 0.63 | ||||||
| PL_HD | 425 | 161 | 16 | 602 | 0.49 | ||||||
| PL_SPD | 70 | 390 | 11 | 161 | 134 | 766 | 0.62 | ||||
| DIR | 123344 | 51 | 123395 | 100.00 | |||||||
| SPD | 60 | 68 | 123180 | 87 | 123395 | 100.00 | |||||
| P | 3193 | 3193 | 2.59 | ||||||||
| T | 196 | 31 | 10 | 237 | 0.19 | ||||||
| RH | 300 | 906 | 4 | 1210 | 0.98 | ||||||
| Total | 130 | 1182 | 264 | 390 | 247260 | 60 | 937 | 644 | 3495 | 254362 | |
| Percent of Total Data Flagged | 0.0096 | 0.0871 | 0.0194 | 0.0287 | 18.216 | 0.0044 | 0.690 | 0.474 | 0.2575 | 18.74 | |
Research Vessel--Malaita | ||||||
|---|---|---|---|---|---|---|
| Variable | Out of Bounds | Failed T„Tw„Td Test | Erroneous Data | Intercompa rison Error | Total Number of Flags | Percent of Variable Records Flagged |
| PL_HD | 2 | 2 | 0.14 | |||
| T | 9 | 310 | 319 | 21.64 | ||
| TD | 9 | 310 | 16 | 335 | 22.73 | |
| RR | 18 | 18 | 1.22 | |||
| Total | 20 | 18 | 620 | 16 | 674 | |
| Percent of Total Data Flagged | 0.1357 | 0.1221 | 4.2062 | 0.1085 | 4.57 | |
Research Vessel--Shiyan (BXMC)--ISS | ||||||||||
|---|---|---|---|---|---|---|---|---|---|---|
| Variable | Out of Bounds | Unrealistic Platform Movement | >4S.D. From Clima
tolog- ical Mean | Erroneous Data | Suspect Data | Platform Moves over Land | Platform Position Uncertain | Spike | Total Number of Flags | Percent of Variable Records Flagged |
| LAT | 4194 | 99 | 434 | 4727 | 3.03 | |||||
| LON | 4194 | 99 | 434 | 4727 | 3.03 | |||||
| PL_HD | 4684 | 466 | 163 | 5313 | 3.40 | |||||
| PL_SPD | 1 | 4064 | 566 | 382 | 324 | 5337 | 3.42 | |||
| DIR | 155953 | 214 | 156167 | 100.00 | ||||||
| SPD | 88 | 1892 | 153932 | 255 | 156167 | 100.00 | ||||
| P | 62145 | 195 | 62340 | 39.92 | ||||||
| T | 13 | 2218 | 1115 | 18 | 3364 | 2.15 | ||||
| RH | 2154 | 165 | 6 | 2325 | 1.49 | |||||
| Total | 1 | 8388 | 101 | 72473 | 313599 | 198 | 1716 | 1175 | 398437 | |
| Percent of Total Data Flagged | 0.0001 | 0.4883 | 0.0059 | 4.2189 | 18.4194 | 0.0115 | 0.0999 | 0.0684 | 23.31 | |
Hartten, L.M., 1996: Reconciliation of Surface and Profiler Winds at ISS Sites. J. Atmos. Oceanic Technol.,
Submitted.
Smith, S.R. and D.M. Legler, 1995a: NetCDF Code Manual for Quality Controlled Surface Meteorological Data. Report COAREMET 95-4, Center for Ocean Atmospheric Prediction Studies, Florida State University, Tallahassee, FL 32310.
Smith, S.R. and D.M. Legler, 1995b: ASCII Code Manual for Quality Controlled Surface Meteorological Data. Report COAREMET 95-11, Center for Ocean Atmospheric Prediction Studies, Florida State University, Tallahassee, FL 32310.
Smith, S.R., J.P. Camp, and D.M. Legler, 1996: TOGA COARE: Handbook of Quality Control Procedures and Methods for Surface Meteorological Data. COAPS Report 96-3, Center for Ocean Atmospheric Prediction Studies, Florida State University, Tallahassee, FL 32310.