
|
|
|
|
|
|
|
|
|
|
|
|
|
|
|
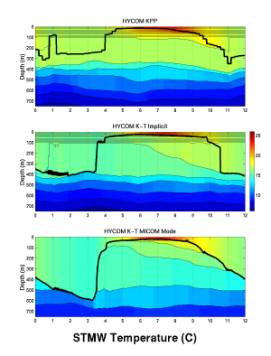
| One
annual cycle of upper ocean |
||||||||||||||
| variability
is illustrated by |
||||||||||||||
| imaging
the temperature field |
||||||||||||||
| and
superimposing the vertical |
||||||||||||||
| coordinate
interfaces and the |
||||||||||||||
| mixed
layer base (thick line). |
||||||||||||||
| The
annual cycle at point STMW |
||||||||||||||
| represents
variability in the |
||||||||||||||
| subtropical
mode water formation |
||||||||||||||
| region
at the northern edge of |
||||||||||||||
| the subtropical
gyre. As |
||||||||||||||
| illustrated
earlier, the mode water |
||||||||||||||
| temperature
is most accurate in |
||||||||||||||
| the KPP
simulation, but |
||||||||||||||
| substantially
too cold in the |
||||||||||||||
| MICOM
mode simulation. |
||||||||||||||