
|
|
|
|
|
|
|
|
|
|
|
|
|
|
|
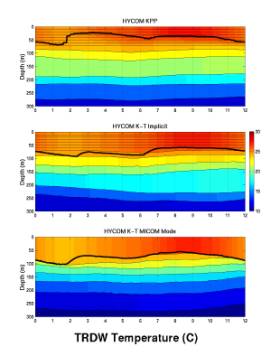
| One
annual cycle of upper ocean |
||||||||||||||
| variability
is illustrated by |
||||||||||||||
| imaging
the temperature field |
||||||||||||||
| and
superimposing the vertical |
||||||||||||||
| coordinate
interfaces and the |
||||||||||||||
| mixed
layer base (thick line). |
||||||||||||||
| The
annual cycle at point TRDW |
||||||||||||||
| represents
variability in the |
||||||||||||||
| North
Atlantic Trade Wind belt |
||||||||||||||
| at
the southern edge of the |
||||||||||||||
| subtropical
gyre. Results are |
||||||||||||||
| generally
similar, but the KPP |
||||||||||||||
| mixed
layer tends to be thinner |
||||||||||||||
| than
in the two K-T mixing |
||||||||||||||
| cases. |
||||||||||||||