
|
|
|
|
|
|
|
|
|
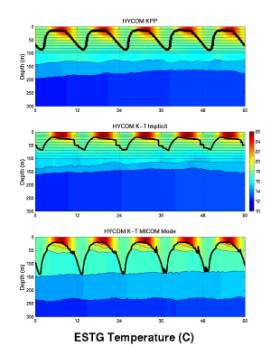
| In
this and the seven subsequent |
||||||||
| slides,
five annual cycles of upper |
||||||||
| ocean
variability are illustrated by |
||||||||
| imaging
the temperature field |
||||||||
| and
superimposing the vertical |
||||||||
| coordinate
interfaces and the |
||||||||
| mixed
layer base (thick line). |
||||||||
| At the ESTG
grid point, |
||||||||
| variability
within the interior |
||||||||
| eastern
subtropical gyre does not |
||||||||
| display
long-term climate drift. |
||||||||