
|
|
|
|
|
|
|
|
|
|
|
|
|
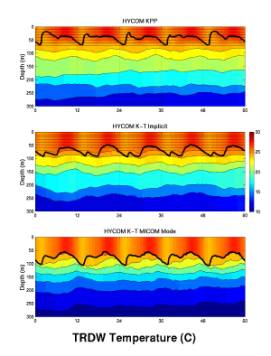
| In
this and the seven subsequent |
||||||||||||
| slides,
five annual cycles of upper |
||||||||||||
| ocean
variability are illustrated by |
||||||||||||
| imaging
the temperature field |
||||||||||||
| and
superimposing the vertical |
||||||||||||
| coordinate
interfaces and the |
||||||||||||
| mixed
layer base (thick line). |
||||||||||||
| At
the TRDW grid point, results |
||||||||||||
| are generally
similar in the |
||||||||||||
| North
Atlantic Trade Wind belt |
||||||||||||
| at
the southern edge of the |
||||||||||||
| subtropical
gyre. The KPP mixed |
||||||||||||
| layer
tends to be thinner than in |
||||||||||||
| the
two K-T mixing cases. Long- |
||||||||||||
| term
climate drift is not observed. |
||||||||||||