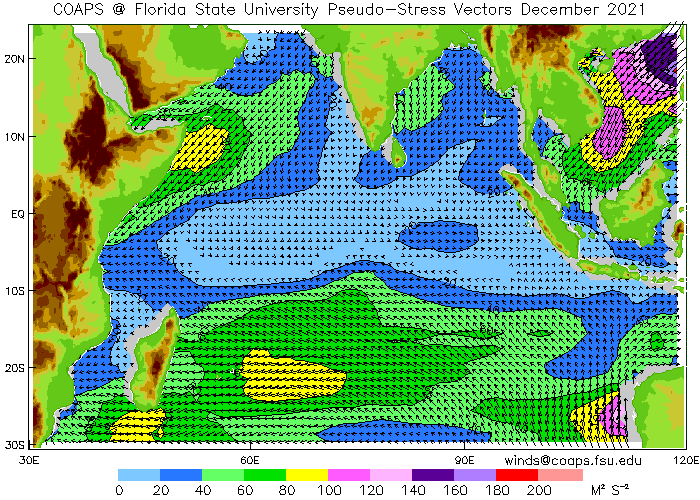


Data Access and Visualizations of the Data


Since many areas of the tropical oceans do not have sufficient ship and buoy data to sample the monthly fields adequately, the latter three methods are thought by many scientists to be preferable. Sufficient data for monthly fields, in the tropics, is generally believed to be a minimum of 30 observations in a 2° latitude by 10° longitude region ( Luther and Harrison (1984); Halpern (1988); Legler (1991)). Only satellite wind scatterometers hold promise to meet this requirement. Low-level cloud data is sparse over the tropics, particularly due to the lack of satellite coverage in large regions of no low clouds or excessive high clouds. General circulation model (GCM) results look promising, but it has been shown that these give poor performance in the tropics, leading to poor surface stress analysis (Lambert and Boer (1988), McPhaden, et al. (1988a); McPhaden, et al. (1988b)).
Currently, programs in the U.S. and France prepare analyses of wind stress fields for the tropical ocean regions. Florida State University (FSU) produces wind stress analyses for the Pacific and Indian Oceans. Dr. J. Servain, Orstom, Brest, produces analyses for the tropical Atlantic Ocean. This atlas represents 16 years of FSU results for the Indian Ocean. Results for the Pacific Ocean can be found elsewhere (Stricherz, et al. (1992)).
The individual wind vector data in the tropical Indian region, 25°N to 30°S, 30°E to 120°E, typically 11,000 observations monthly, are first converted to pseudo-stress. A pseudo-stress vector is defined as the wind components multiplied by the wind magnitude. A pseudo-stress vector of 60 m2s-2 corresponds to 1 dyne cm-2 assuming a drag coefficient of 1.4 x 10⁻³ and an air density of 1.2 kg m-3.
Objective filtering is then applied to the data to eliminate questionable pseudo-stress reports. For each month, a basin-wide average was found for both the x and y components. Upper and lower limits for each were set to be this average value +/-30 times the average. If either component fell outside this range, the entire observation was deleted. Less than 1% of all reports were removed.
The remaining observations were then averaged in 1° boxes. The final screening dealt with each box individually. In boxes with greater than 5 observations per month, individual observations were removed when either component was greater than +/-3.9 standard deviations from the average value. Again, typically less than 1% of the reports were removed. The remaining reports were averaged onto a 1° grid with empty boxes primarily in areas outside of the shipping lanes.
A variational direct-minimization objective analysis is performed on these data using the 1° gridded data as a first guess [see Legler,Navon and O'Brien (1989)]. The cost functional which is to be minimized consists of five constraints, each expressing a lack of fit to prescribed conditions. These constraints include a proximity to the input data, a measure of roughness, and kinematic agreements to expected climatological patterns. The resulting fields are on a 1° grid.
Each spring, a more complete set of marine reports is obtained from National Climatic Data Center (NCDC) for the previous calendar year. This set contains data already received via the GTS and supplemental reports that were received late. The increase in the number of observations in the tropical Indian regions is about 10-25%. The analysis procedure is the same for this more complete data set, and the results constitute the "research quality" product.
For the period 1970-1979, the reanalyzed "research quality" products are based on Comprehensive Ocean Atmosphere Data Set (COADS, Slutz et al.1985).
Internet: winds@coaps.fsu.edu
Telephone:
(850) 644-4581
(850) 644-4841 FAX
US Mail:
Center for Ocean-Atmospheric Prediction Studies
The Florida State University
Tallahassee, FL 32306-2840
U.S.A.
Stricherz, J., J. J. O'Brien, and D. M. Legler, 1992: Atlas of Florida State University Tropical Pacific Winds for TOGA 1966-1985, Florida State University, Tallahassee, FL, 250 pp.
Further information on WOCE-MET Web pages can be obtained by mailing: wocemet@coaps.fsu.edu.
Last Modified: Tue, 4 Jan 2022