The impacts of the El Niño-Southern Oscillation (ENSO) on hurricane activity in the Atlantic Basin have been shown in previous research. Gray (1984) showed that overall Atlantic hurricane activity is reduced during El Niño and increased during La Niña. Although past studies have included Caribbean hurricanes, they fail to quantify the regional probability of hurricane landfall during ENSO phases. In the present study, hurricane landfall frequencies are calculated for the Caribbean as a whole and separately for the North, East, and West Caribbean. The impact of ENSO on landfall probabilities is evaluated for each region.
Two similar studies outlined the impacts of ENSO on landfalling hurricanes in the United States. Richards and O’Brien (1996) found that the probability of two or more hurricanes making landfall in the United States was only 21% during an El Niño event but 44% during the neutral phase. The work by Bove et al. (1998) revisited Richards and O’Brien using a longer time period and corrected U.S. hurricane data. Bove et al. (1998) found that the probability of two or more hurricanes making landfall along the U.S. coast was 28% during El Niño and 48% during the neutral phase. The present study extends the analysis of Bove et al. (1998) to the Caribbean.
The number of hurricane landfalls that occurred in the Caribbean is determined for each year between 1900 and 1998 using the Atlantic Basin Hurricane Best Track data provided by the National Hurricane Center/National Climatic Data Center (Neumann et al. 1993). Herein landfall is defined when the nearest approach of the hurricane center is less than 80 km. This definition is preferable to using just the storm center because the center need not cross land for the hurricane to have substantial impact on lives and property. Landfall frequencies are examined with respect to the warm (El Niño), neutral, and cold (La Niña) ENSO phases. For this study only hurricanes (winds ³ 64 kts) are considered. Overall, the analysis shows an increase in hurricane landfall probability for the whole Caribbean during cold ENSO phase years and a decrease during warm phase years when compared to neutral years. Regional results differ from the whole Atlantic findings of Gray (1984) and include the lack of a warm phase reduction in hurricane landfalls, relative to the neutral phase, in the East and West Caribbean.
Quantifying the ENSO landfall probabilities in the Caribbean is important for seasonal forecasting and disaster preparedness. Improvements in forecasting the ENSO phase, coupled with the probabilities presented, will allow governments and emergency planners in the Caribbean to know the relative risk level for a given hurricane season.
a. El Niño/La Niña
The warm and cold phases of ENSO are often defined using an index of equatorial Pacific sea surface temperatures (SST). Although there has been some disagreement as to which index best defines ENSO phases, the Japanese Meteorological Agency (JMA) index has proven reliable for qualitative studies (Trenberth 1997, Hanley et al. 2002), and is chosen for the present analysis. The JMA defines a warm phase when the five-month running average of SST anomalies over the tropical Pacific (4°S-4°N, 150°W-90°W) is greater than 0.5ºC for at least six consecutive months including October, November, and December (JMA Atlas, 1991). A cold phase is similarly defined when SST anomalies in this region are less than -0.5ºC for at least six consecutive months including October, November, and December. All years that are not categorized as warm or cold are classified as neutral years.
An ENSO year is typically defined using the JMA index as the period from October in the year that the warm (or cold) phase develops until the following September (Table 1). This definition is designed to capture the peak of an ENSO event in the boreal winter. Since the hurricane season runs from June through November, the typical ENSO year definition would split a hurricane season across two different ENSO years. Rather than classifying hurricane seasons using the standard ENSO definition, the authors first follow Bove et al. (1998) and classify hurricane seasons according to the onset year in which the cold, warm, or neutral phase begins. For example, the 1992 hurricane season spans the end of the 1991 warm ENSO year for June-September and the onset of the 1992 neutral ENSO year for October-November. Using the method of Bove et al. (1998), the 1992 season would be classified as a neutral hurricane season. Based on this method, the ENSO classification for each hurricane season from 1900 to 1998 is found in Table 1.
Table 1: List of ENSO years as defined by the JMA index. An ENSO year is defined as starting in October of the year listed in the table and ending in September of the following year. Based on the method of Bove et al. (1998), the table also lists the ENSO classification for entire hurricane seasons. For example, 1997 in the table represents both the ENSO warm phase year (Oct. 1997 - Sep. 1998) and the warm phase classification of the 1997 hurricane season (Jun. - Nov. 1997). Row indicates decade, column indicates year. (W = Warm phase, N = Neutral, C = Cold phase)
|
0 |
1 |
2 |
3 |
4 |
5 |
6 |
7 |
8 |
9 |
|
|
190 |
N |
N |
W |
C |
W |
W |
C |
N |
C |
C |
|
191 |
C |
W |
N |
W |
N |
N |
C |
N |
W |
N |
|
192 |
N |
N |
C |
N |
C |
W |
N |
N |
N |
W |
|
193 |
W |
N |
N |
N |
N |
N |
N |
N |
C |
N |
|
194 |
W |
N |
C |
N |
C |
N |
N |
N |
N |
C |
|
195 |
N |
W |
N |
N |
C |
C |
C |
W |
N |
N |
|
196 |
N |
N |
N |
W |
C |
W |
N |
C |
N |
W |
|
197 |
C |
C |
W |
C |
N |
C |
W |
N |
N |
N |
|
198 |
N |
N |
W |
N |
N |
N |
W |
W |
C |
N |
|
199 |
N |
W |
N |
N |
N |
N |
N |
W |
C |
The authors do acknowledge that this method of classification may not be accurate for hurricanes that occur before October. In an effort to assess the impact of the Bove et al. (1998) classification, each hurricane season was then divided into two time periods. The first includes hurricanes occurring from June through September (JJAS), while the second includes hurricanes that occur during October and November (ON). JJAS and ON hurricanes are classified by the ENSO year in which they actually occur. For example, using the Bove et al. (1998) method, the entire (June through November) 1992 hurricane season would be classified as neutral; however, when dividing the season, JJAS are classified as warm while ON are considered neutral. Thus, ON hurricanes are classified by the same ENSO year as they are using the Bove et al. method, while JJAS hurricanes are classified by the preceding ENSO year.
b. Study Regions
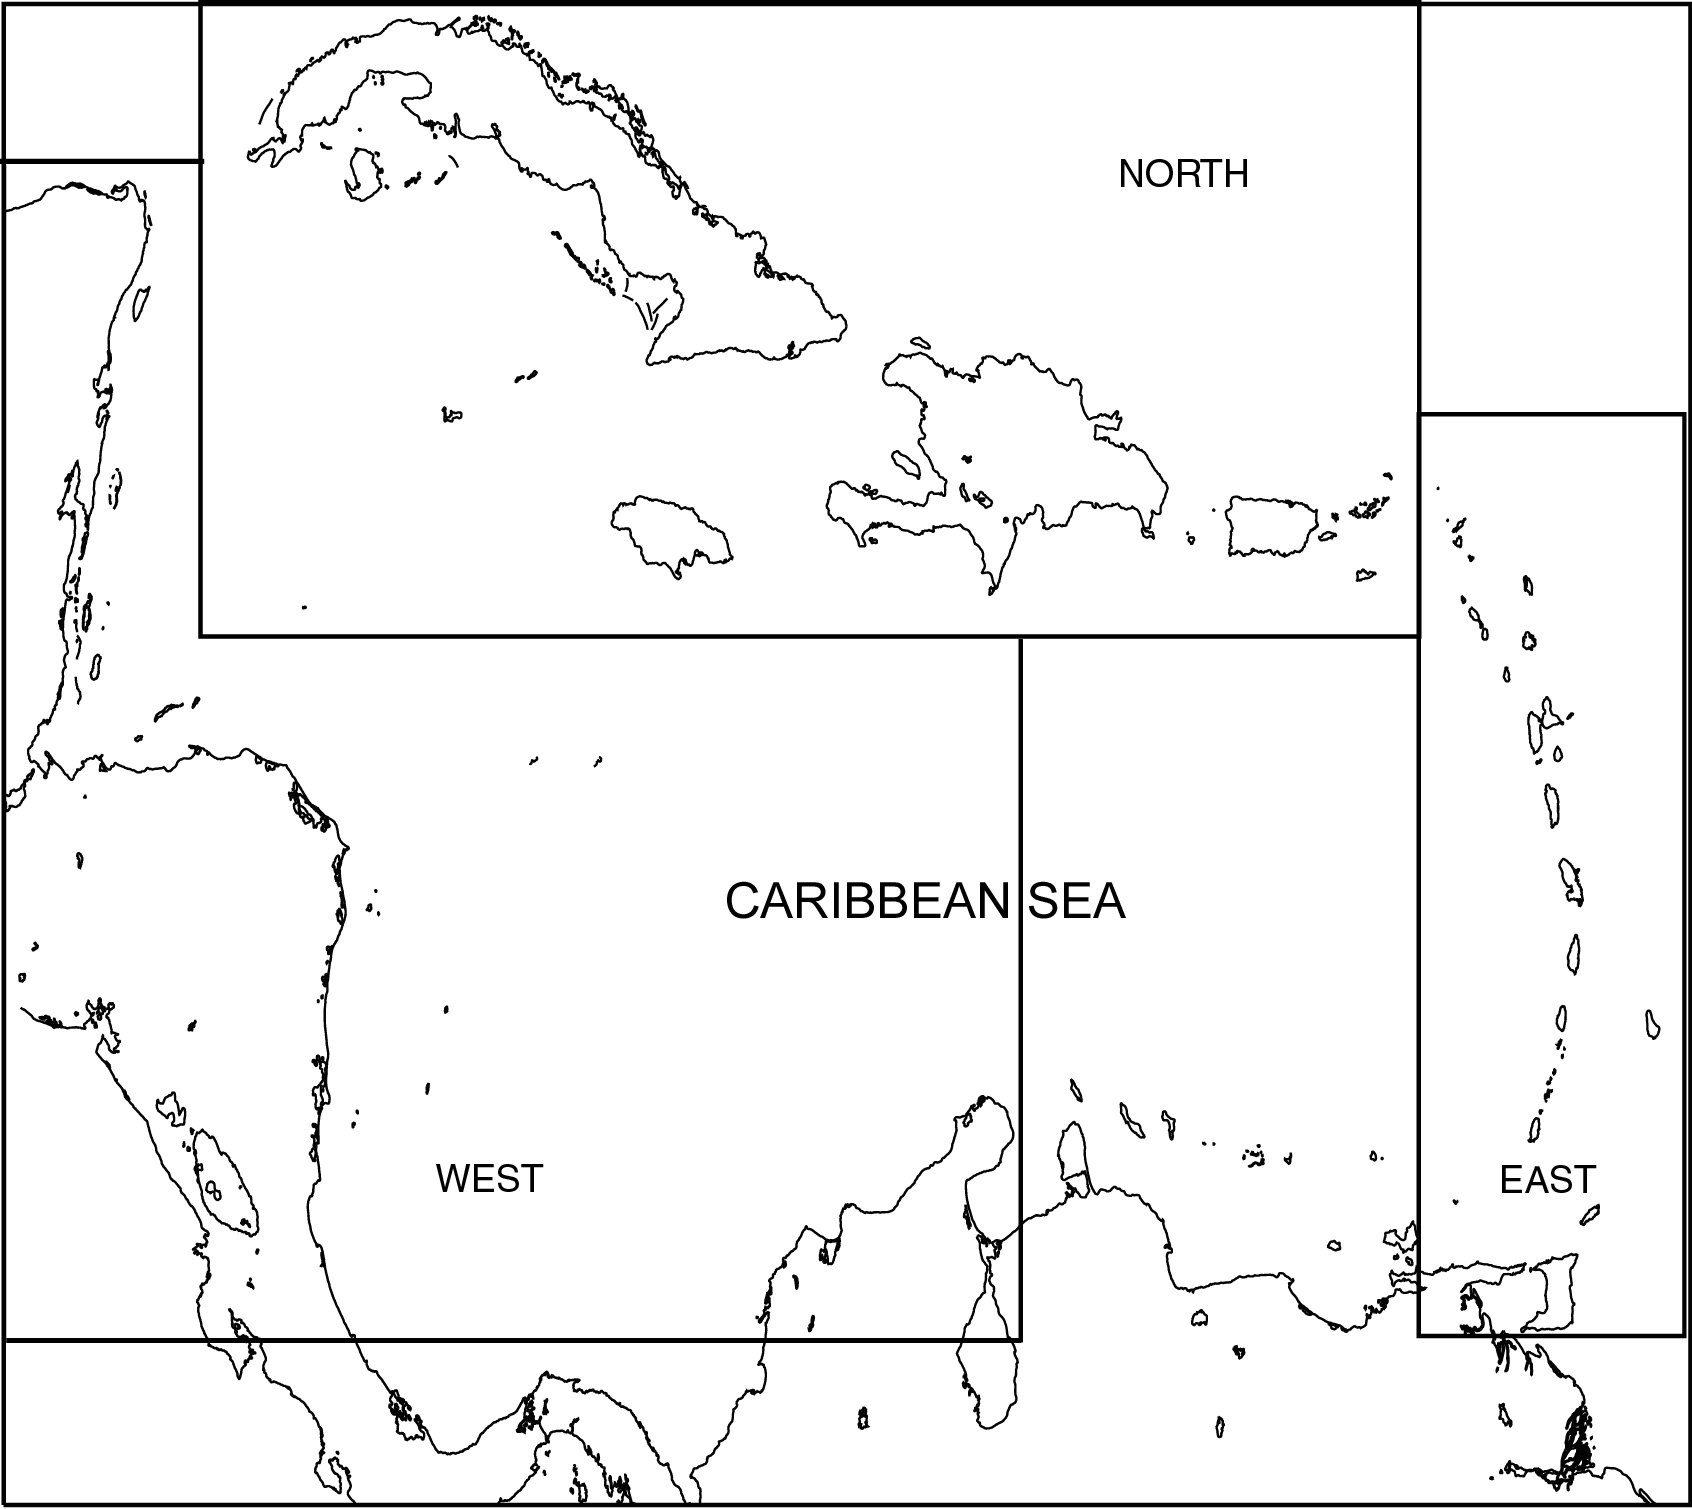
Landfall frequencies are determined for the countries surrounding the Caribbean Sea between 8.4ºN and 23.2ºN and 57.0ºW and 89.0ºW (Fig. 1). The study area was divided a priori into the North, East, and West Caribbean. These three regions represent the geographic boundaries of the Caribbean. The North Caribbean includes Cuba, Jamaica, Puerto Rico, Hispaniola, and the Virgin Islands; the East Caribbean includes the northeastern coast of South America and the Lesser Antilles east of the Virgin Islands; and the West Caribbean includes the Yucatan Peninsula down through the coast of northwestern South America (Fig. 1).
 |
The Atlantic Basin Best Track data (Neumann et al. 1993) are used to determine hurricane landfalls. The Best Track data are composed of six-hourly observations (0Z, 6Z, 12Z, and 18Z) of storm center position, wind speed, and pressure (if available). The latitude and longitude of each storm that passed through our defined boundaries are compared with the ETOPO5 topography data (NGDC 1988) to determine whether landfall occurred. A hurricane is counted as making landfall if its storm center position is identified by the ETOPO5 data as having been within 80 km of land at least once within our defined boundaries. The 80 km radius accounts for storms which pass between islands or come very close to an island. Although the center does not actually cross land, these islands are often impacted by hurricane force winds. The radius of hurricane force winds can vary depending on the size of the individual storm (C. Landsea, personal communication, 2002). An 80 km radius was chosen as a compromise between very large and small hurricanes.
Since the ETOPO5 data is based upon a five-minute by five-minute grid, many of the smaller islands in the Caribbean are not resolved by this database. Landfalls for these smaller islands are identified visually using hurricane track plots.
The problem of a single hurricane making several landfalls in the Caribbean is handled by defining a "landfalling" hurricane as a storm that made landfall at least once within a region with winds greater than or equal to 64 kts. The Caribbean is divided into three separate regions and each region is treated individually. If a hurricane makes landfall in both the East Caribbean and the North Caribbean, it is counted as a landfalling hurricane for both regions. However, the same hurricane is counted only once for the Caribbean as a whole. Once landfalling hurricanes are identified for the Caribbean regions, each storm can be categorized as occurring during a warm, cold, or neutral ENSO phase.
Using an analysis period of 99 years from 1900-1998, a total of 123 landfalling hurricanes are identified in the Caribbean. The frequency of hurricanes making landfall in each ENSO phase is calculated for the 22 warm years, 23 cold years, and 54 neutral years. Inverse cumulative frequency distributions are used to find strike probabilities. Also known as "exceedence," the inverse cumulative frequency distribution shows the probability of a particular number or more hurricanes making landfall. For example, the probability of zero or more hurricanes making landfall would be 100%. The probability of one or more hurricanes making landfall would be 100% minus the probability of zero hurricanes making landfall.
The data are also analyzed using a Poisson distribution, which is characterized by the mean being equal to the variance. Since the Poisson inverse cumulative frequencies are very similar to the cumulative frequencies obtained from the data, only the cumulative frequencies obtained from the data are shown in this paper.
Individual statistical tests of the differences in ENSO extreme (warm or cold) versus neutral landfall frequencies are completed for each Caribbean region. Individual hurricane landfalls are treated as independent, making the number of landfalls within a hurricane season, X, a discrete random variable. Since the number of landfalls per hurricane season is a discrete random variable, the equivalence of landfall frequencies between ENSO extreme and neutral phases can be tested in terms of two Poisson populations.
A discrete random variable, X, is distributed as a Poisson random variable with parameter µ, the mean amount of events in the population, if the probability mass function of the variable is
(Taylor 1982). Further, if x1, x2, …, xn is a sample of size n from a Poisson distribution with parameter µ, then ![]() has a Poisson distribution with parameter nµ (Lehmann 1986). The authors treat the distribution of hurricane landfalls for extreme (neutral) ENSO phases as a Poisson random variable, X (Y), with parameter µx (µy), where µx (µy) is the landfall frequency in hurricane seasons classified as an extreme (neutral) ENSO phase.
has a Poisson distribution with parameter nµ (Lehmann 1986). The authors treat the distribution of hurricane landfalls for extreme (neutral) ENSO phases as a Poisson random variable, X (Y), with parameter µx (µy), where µx (µy) is the landfall frequency in hurricane seasons classified as an extreme (neutral) ENSO phase.
Significant differences in hurricane landfall for extreme versus neutral ENSO phases are identified using a z-test based on a joint Poisson distribution. A null hypothesis is formulated which states that the two Poisson populations represented by the two rates of occurrence, µx and µy are statistically similar. The alternative hypothesis assumes that the rates of hurricane landfalls are significantly different.
The Poisson significance test allows rejection of the null hypothesis when a station has either significantly more or fewer landfalls during hurricane seasons classified as an extreme versus neutral ENSO phase. Data for the test procedure include the number of hurricane landfalls, x, that occur in nx valid ENSO extreme hurricane seasons and the number of landfalls, y, that occur in ny valid ENSO neutral seasons. The total number of landfalls is represented by t (t = x + y).
The test procedure, outlined in Lehmann (1986), is based on the joint distribution of the independent random variables X and Y. Given X+Y=t, X has a conditional binomial distribution with parameters t and p=![]() ; therefore,
; therefore,
![]() x = 0, 1, 2, …, t (2)
x = 0, 1, 2, …, t (2)
under the null hypothesis. When the total number of landfalls, t, is greater than 25, (2) can be approximated by a normal distribution. The resulting z-test statistic, with a continuity correction, is formulated as
 . (3)
. (3)
Caribbean regions where the null hypothesis is either rejected or accepted are identified by comparing the Z-statistic from (3) to the 95% and 99% confidence level values. Rejecting the null hypothesis leads to acceptance of the alternative hypothesis; thus, a statistically significant shift in the rate of hurricane landfalls between neutral and extreme ENSO phases is identified.
The analysis begins with Caribbean landfalls, which are classified by ENSO phase according to the method of Bove et al. (1998). The results for the Caribbean as a whole are described followed by a breakdown into the North, East, and West Caribbean. These results are compared to JJAS and ON landfalls classified according to the ENSO phase in which the hurricane occurs (see section 2a).
a. Entire Hurricane Season
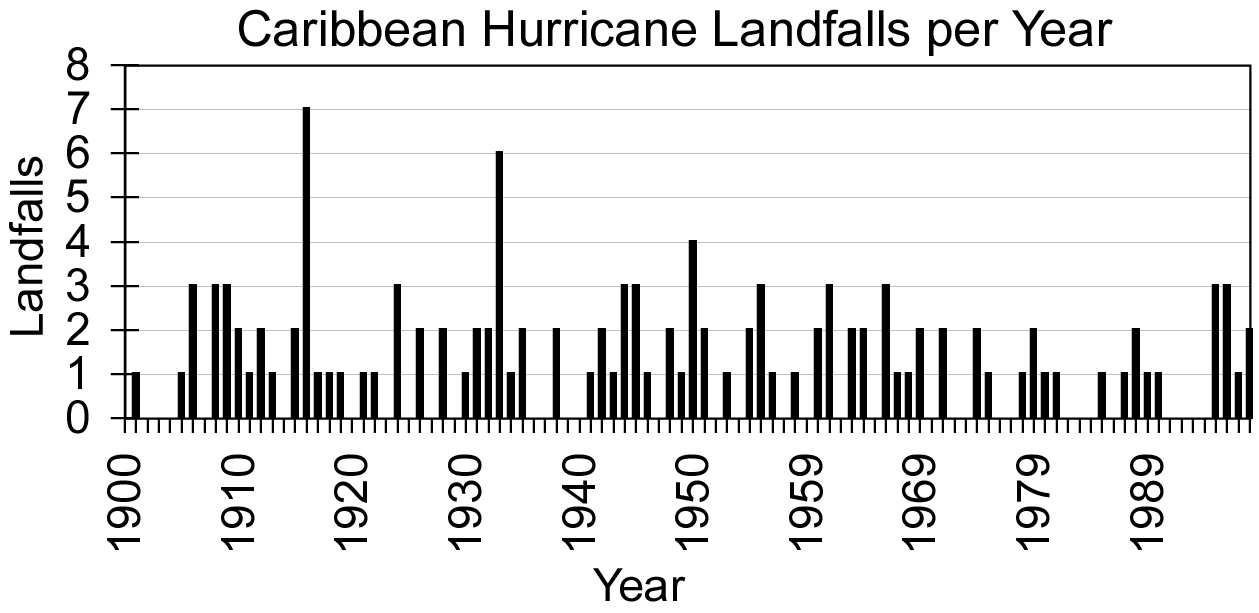
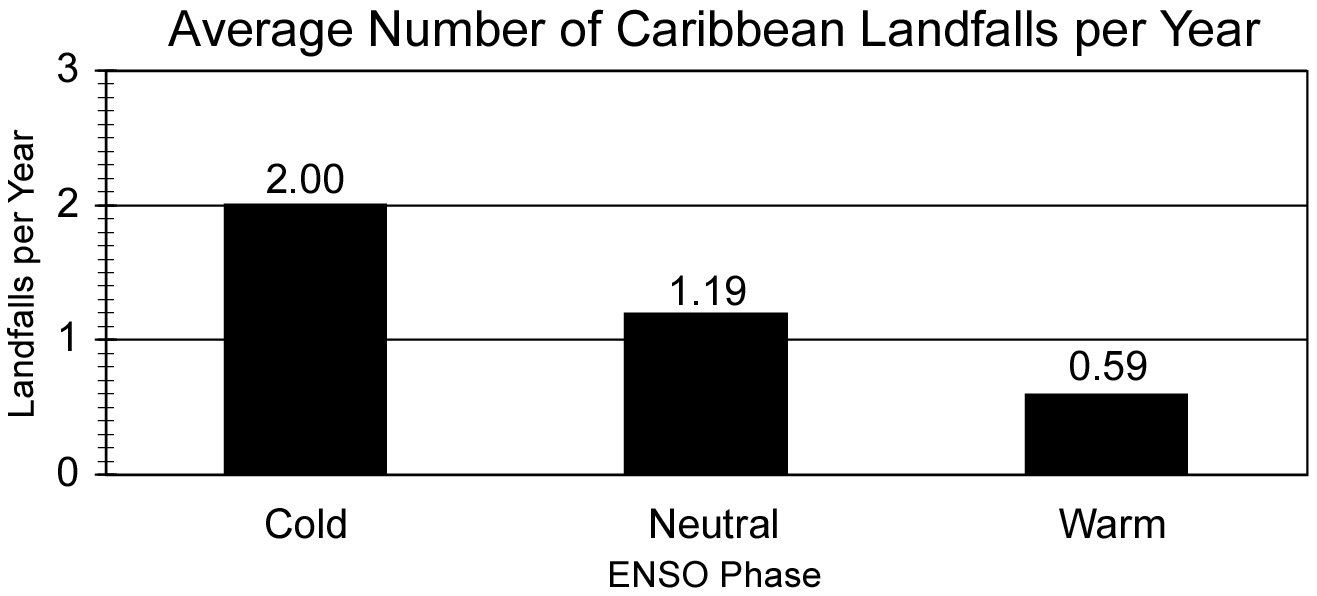
The 123 hurricane landfalls between 1900 and 1998 show clear inter-annual variability (Fig. 2). The most hurricanes (seven) to make landfall within one season of the study period occurred during the cold ENSO season of 1916. Overall, seasons classified as cold phases are the most likely to have two or more hurricanes make landfall while those classified as warm phases are most likely not to have any landfalling hurricanes. The average number of hurricane landfalls per season for each ENSO phase shows the highest frequency associated with cold phases (Fig. 3). Forty-six hurricanes made landfall in the Caribbean during the 23 cold phase years, which is an average rate of 2.0 hurricanes making landfall per year. In contrast, only thirteen hurricanes made landfall during the 22 warm phase years, or 0.59 landfalls per year. The results reveal a more than 3:1 ratio of hurricane landfalls per season between cold and warm ENSO phases.
 |
 |
|
| Fig. 2: Number of hurricanes per year that made landfall in the Caribbean from 1900-1998. | Fig. 3: Average number of hurricane landfalls in the Caribbean from 1900-1998 during years classified using the method of Bove et al. (1998) as warm, neutral, or cold ENSO phases. |
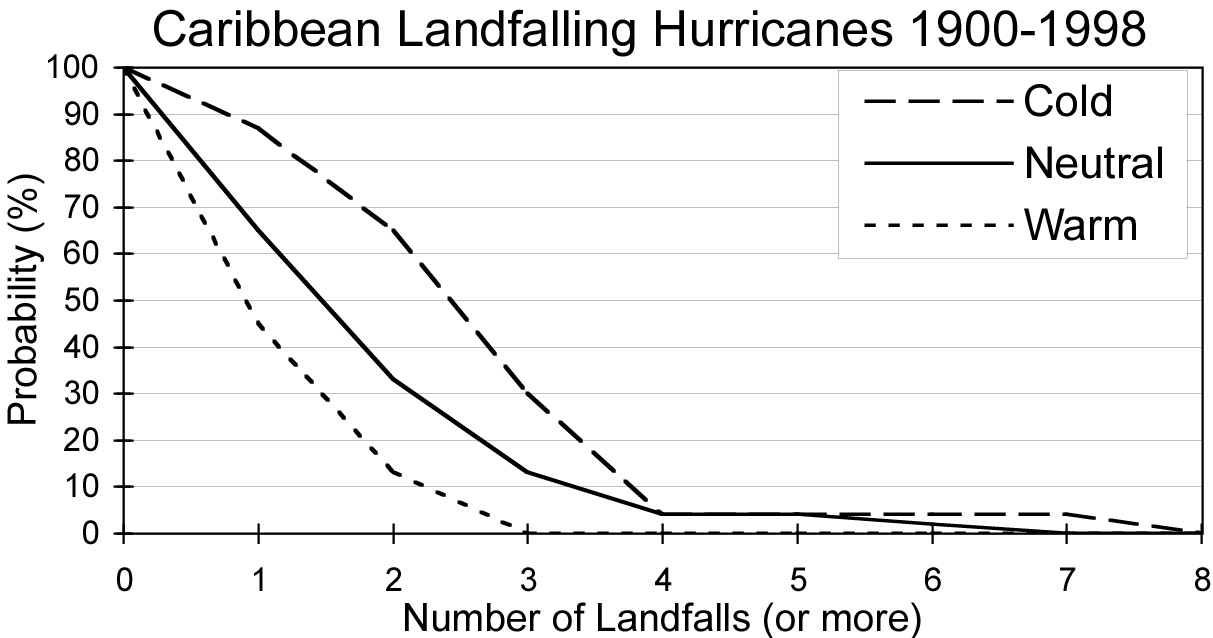
The relationship between ENSO phases and hurricane landfalls in the Caribbean is similar to that for hurricane activity in the entire Atlantic Basin. Cold phases are observed to have more hurricane landfalls than neutral years while warm phases see fewer hurricane landfalls (Gray 1984) in the Atlantic Basin. Inverse cumulative frequencies (Fig. 4) show only a 13% probability of two or more hurricanes making landfall during warm phases. During neutral years this probability increases to 33%, while the probability of two or more hurricanes making landfall during the cold phase is 65%. The probability of three or more hurricane landfalls during the cold phase is 30%, while no warm phase years between 1900 and 1998 are observed to have three or more landfalls. Using a 99% confidence limit, a significant difference between both the warm and cold phases of ENSO and the neutral phase is identified from the Poisson test. However, the relationship between warm, cold, and neutral phase landfall probabilities for the Caribbean as a whole does not hold true for the individual regions of the Caribbean.
 |
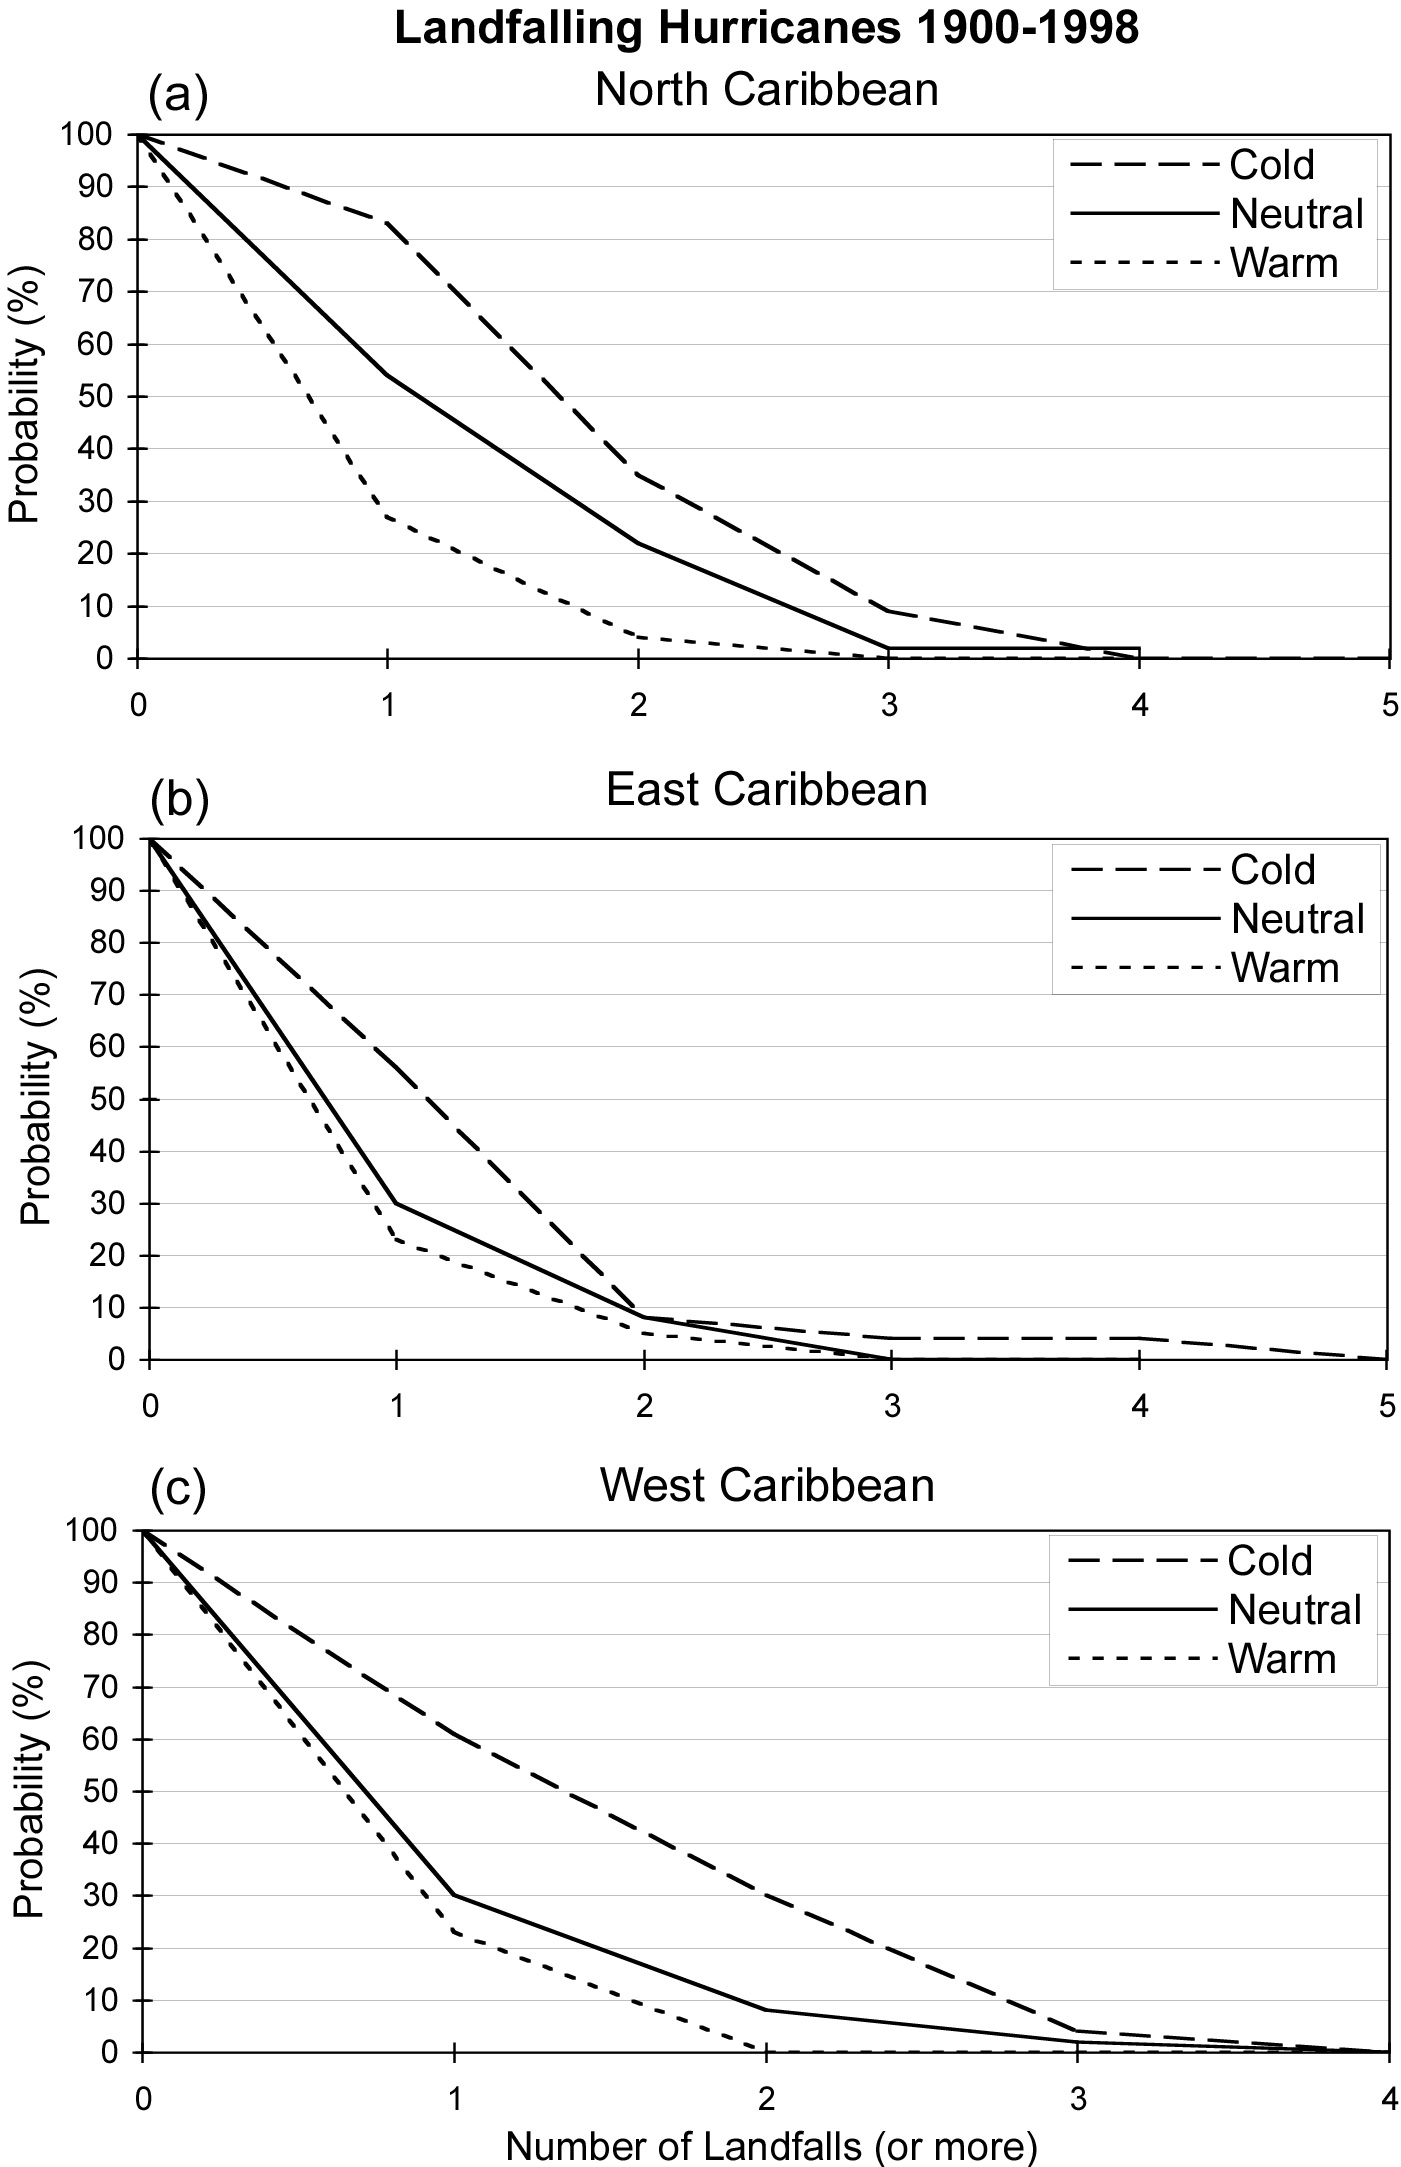
Between 1900 and 1998 no single year has more than four hurricane landfalls in the North Caribbean, and the number of years with only one landfall is double the number of years with two landfalls. There is an increased probability of hurricane landfalls in the Northern Caribbean during the cold phase in comparison to the neutral phase (Fig. 5a). The chance of one or more hurricanes making landfall during a cold phase year is 83% versus 54% during neutral years. Warm years show a decrease in hurricane landfalls compared to neutral years with only a 27% probability for one or more hurricanes making landfall. Differences in landfall frequency in the North Caribbean are found to be significant for both cold ENSO phase (95% level) and warm ENSO phase (99% level) relative to the neutral phase.
The East Caribbean has not seen more than two landfalling hurricanes in any warm or neutral phase year from 1900 to 1998. In contrast to the North Caribbean (Fig. 5a), the East Caribbean has no significant (95% level) decrease in hurricane landfalls during the warm phase relative to neutral years (Fig. 5b); however, a significant (95% level) increase in hurricane landfalls during cold years relative to neutral years is observed. The probability of one or more landfalling hurricanes is 56% in the East Caribbean during cold years, which is nearly double that noted during neutral years (30%). Probabilities of landfall during warm years (23% for one or more hurricanes) are only slightly less than the landfall probabilities for neutral years.
The West Caribbean exhibits results very similar to the East Caribbean. The probability of one or more hurricanes making landfall is 61% during a cold phase, which is double that observed during neutral years (30%; Fig. 5c). The probability of one or more landfalling hurricanes during warm years, only 23%, is very close to the probability during neutral conditions. Statistical analysis reveals a significant (99% level) increase in hurricane landfall probabilities during cold phase years compared to neutral years; however, using both 99% and 95% confidence limits, there is no significant difference in warm phase and neutral phase hurricane landfalls.
 |
Comparing results for the East, West, and North Caribbean suggests that the effects of the ENSO warm phase on hurricane landfall activity are experienced only on a regional level. The northern portion of our study region shows a statistically significant decrease in hurricane landfalls in warm years when compared to neutral years that is not observed in the East or West Caribbean. The intensifying influence of the cold ENSO phase on hurricane landfalls, however, is observed throughout the entire Caribbean.
b. June — September (JJAS)
A separate analysis is done on hurricanes occurring before October for each hurricane season. As noted in section 2a, these hurricanes are classified by the ENSO phase in which they occur. This analysis reveals results contradictory to previous analyses. For all three regions of the Caribbean, JJAS hurricane landfalls are more likely to occur during a neutral phase than a cold or warm phase. Also, there appears to be little difference in the probability of hurricane landfalls between warm and cold phase years.
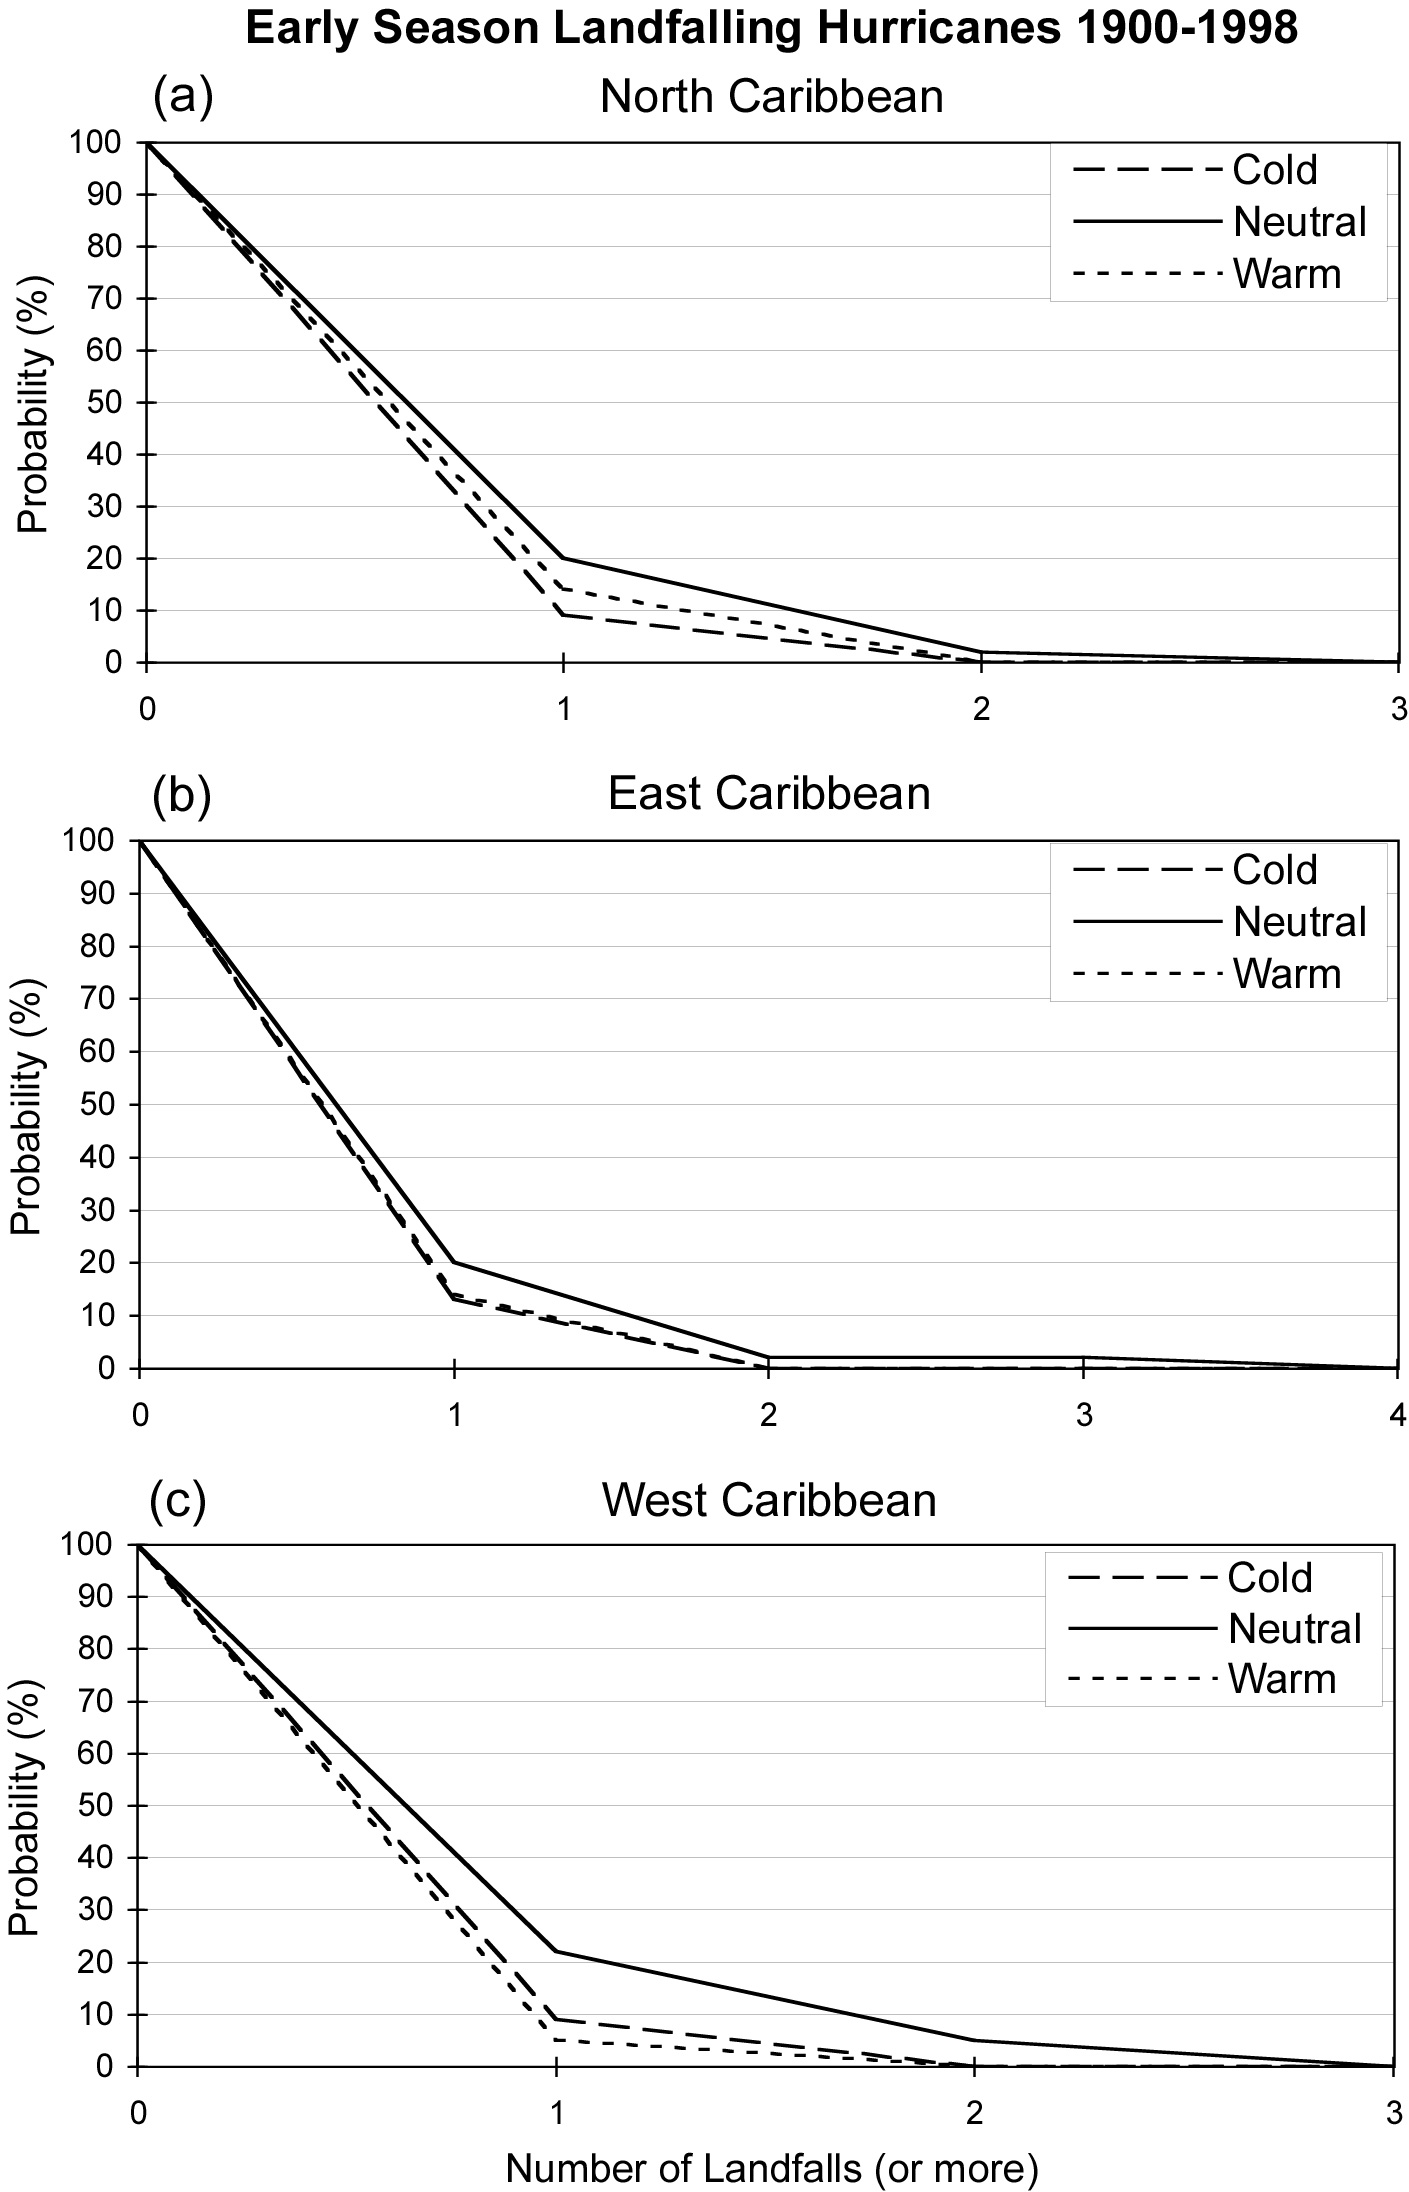
In the North Caribbean, the probability of one or more hurricanes making landfall is 20% during neutral years, 14% during warm years, and 9% during cold years (Fig. 6a). For the East Caribbean, the probability distribution is almost identical. The probability of one or more hurricanes making landfall is 20% during the neutral phase, 14% during the warm phase, and 13% during the cold phase (Fig. 6b). In the West Caribbean the probability of one or more hurricane landfalls is 22% during the neutral phase, 9% during the cold phase, and 5% during the warm phase (Fig. 6c). Comparing the JJAS results to the Bove et al. (1998) classification implies that JJAS hurricane landfalls are less influenced by the decaying ENSO phase in which they occur than they are by the onset of a new ENSO event.
 |
c. October-November (ON)
October and November hurricanes are classified by the same ENSO phase as the overall hurricane season (section 4a); thus, similar results are revealed. An increase (decrease) in hurricane landfall probability relative to neutral phases occurs in all three regions of the Caribbean during cold (warm) phases. Similar to what was observed for the entire hurricane season (Fig. 5), the warm phase decrease in hurricane landfalls compared to neutral years was less than the cold phase increase compared to neutral years for the East and West Caribbean.
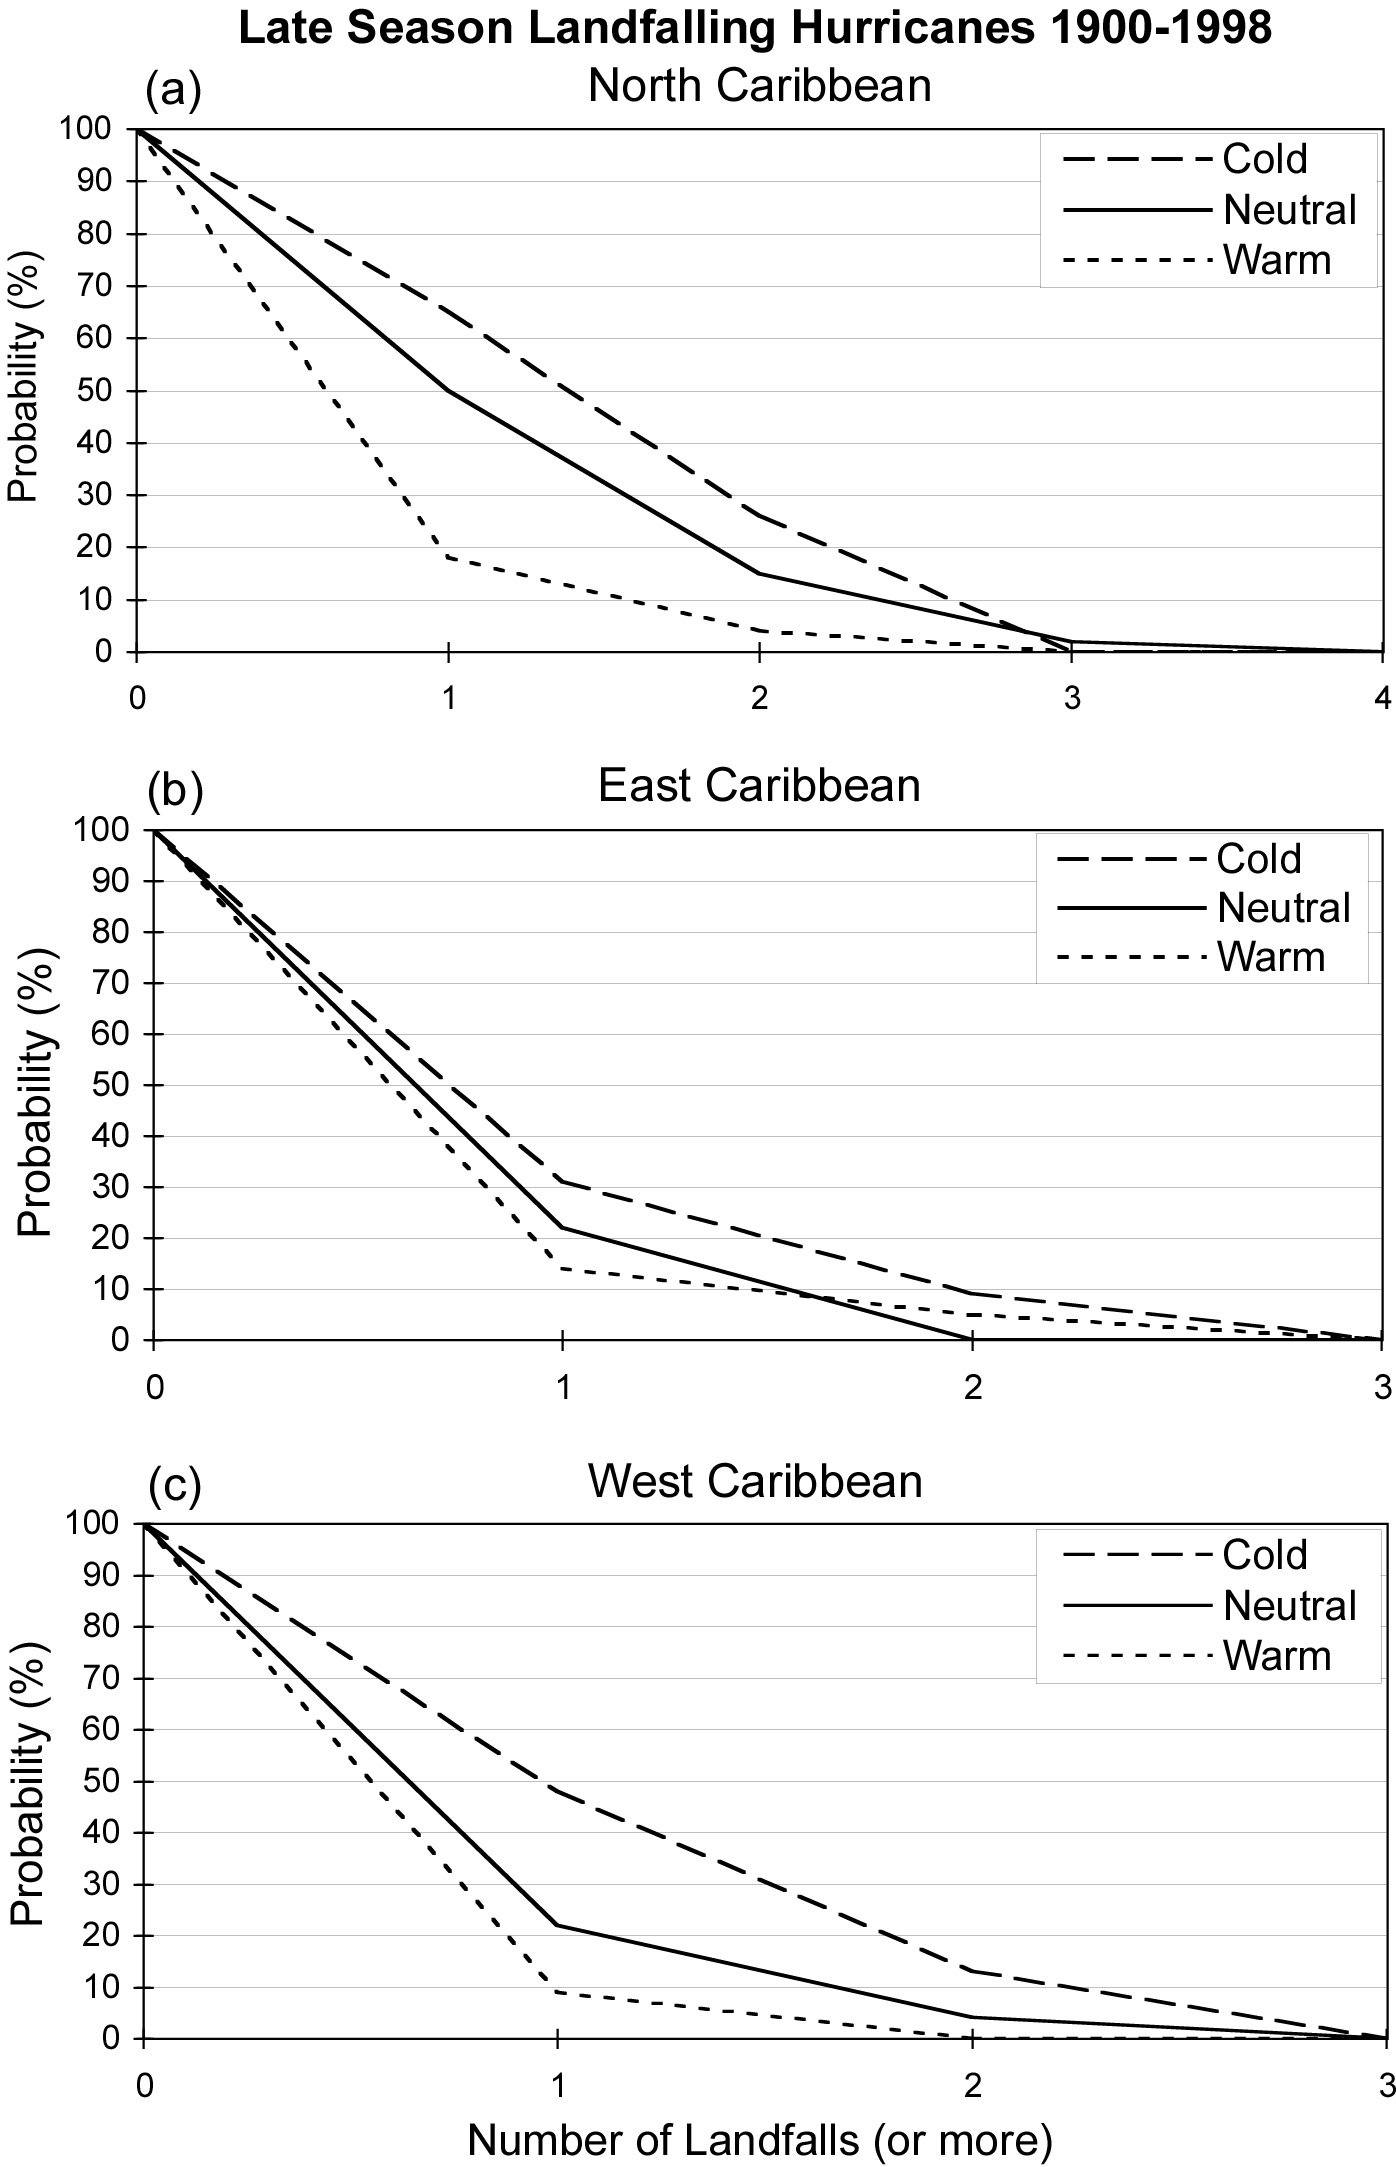
The probability of one or more ON hurricane landfalls in the North Caribbean is 65% during the cold phase, 50% during the neutral phase, and 18% during the warm phase (Fig. 7a). In the East Caribbean, the probability of one or more hurricane landfalls is 31% during the cold phase, 22% during the neutral phase, and 14% during the warm phase (Fig. 7b). The probability of one or more hurricane landfalls for the West Caribbean is 48% during cold years, 22% during neutral years, and 9% during warm years (Fig. 7c). Because the ON hurricanes are classified by the same ENSO phase as the entire hurricane season, it is not surprising that the probability distribution is much like what was observed for the hurricane season as a whole.
 |
The present frequency analysis reveals a relationship between hurricane landfall activity in the Caribbean and the phases of ENSO. When classified according to Bove et al. (1998), the cold phase tends to increase landfall probabilities in the Caribbean relative to neutral or warm phases. These findings agree with the previous results of Gray (1984). Gray showed the ENSO warm phase decrease in Atlantic hurricanes to be the result of anomalously strong upper level westerly winds, which hinder tropical cyclone development over the Caribbean and Eastern Atlantic Basin. In addition, Shapiro (1987) found that an increase in low-level anticyclonic vorticity is found in the warm phase of ENSO. Combined with Gray’s findings, this also plays a role in decreasing tropical cyclone formation during El Niño. During the cold phase upper level winds tend to be more easterly than neutral phase, favoring hurricane development in the deep tropics. When splitting the hurricane season across ENSO seasons, and classifying hurricanes prior to October by the decaying ENSO phase of the previous year, results vary significantly from the Bove et al. (1998) classification. It appears that JJAS hurricanes are less affected by the decaying ENSO phase and more influenced by the onset of the ENSO phase in October.
Mechanisms driving the regional ENSO variability in hurricane landfalls in the Caribbean have not been identified. The analysis of Gray (1984) does not directly explain why warm phase years and neutral years exhibit virtually no difference in hurricane landfalls in the East and West Caribbean. It appears that the influence of the ENSO warm phase is not as strong in the East and West Caribbean; however, in a cold phase, the probability of a hurricane making landfall is increased throughout the entire Caribbean. The regional variability in the influence of ENSO presented herein warrants further investigation. Future work will explore several factors including hurricane formation regions, steering flow, and the possible effects of the North Atlantic Oscillation.