
Figure 1. Five-month running mean of sea surface temperature
anomalies in the eastern Equatorial Pacific Ocean. Temperature thresholds for El
Niño (red) and La Niña (blue) are marked. Back

Figure 2. Spatial area included in this study. Red
lines show 2.5° by 2.5° bins that were used to perform analyses. Back Figure 3. (a). Geographic regions where changes in
tornadic activity were found during El Niño. (b). Geographic regions where changes
in tornadic activity were found during El Niño. Red lines show 2.5° by
2.5° bins that were used to perform analyses. Back Figure 4. Differences in the seasonal number of tornado
events in 2.5° by 2.5° bins during El Niño as compared to neutral ENSO
conditions. (a) JFM season. (b) FMA season. (c) MAM season. (d) AMJ season. Back Figure 5. Differences in the seasonal number of tornado
days in 2.5° by 2.5° bins during El Niño as compared to neutral ENSO
conditions. (a) JFM season. (b) FMA season. (c) MAM season. (d) AMJ season. Back Figure 6. Statistically significant differences in the
seasonal number of tornado events in 2.5° by 2.5° bins during El Niño as
compared to neutral ENSO conditions. (a) JFM season. (b) FMA season. (c) MAM season. (d)
AMJ season. Back Figure 7. (a) Bootstrapped tornado histogram during MAM
Warm Event, 1.25° by 1.25° region near Dallas, Texas. (b) Bootstrapped tornado
histogram during MAM Warm Event, 1.25° by 1.25° region near Shreveport,
Louisiana. Back Figure 8. Differences in the seasonal number of tornado
events in 2.5° by 2.5° bins during La Niña as compared to neutral ENSO
conditions. (a) JFM season. (b) FMA season. (c) MAM season. (d) AMJ season. Back Figure 9. Differences in the seasonal number of tornado
days in 2.5° by 2.5° bins during La Niña as compared to neutral ENSO
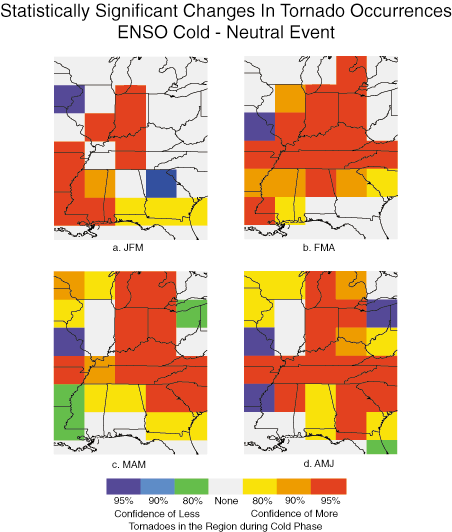
conditions. (a) JFM season. (b) FMA season. (c) MAM season. (d) AMJ season. Back Figure 10. Statistically significant differences in the
seasonal number of tornado events in 2.5° by 2.5° bins during La Niña as
compared to neutral ENSO conditions. (a) JFM season. (b) FMA season. (c) MAM season. (d)
AMJ season. Back Figure 11. (a) Bootstrapped tornado histogram during
MAM Cold Event, 1.25° by 1.25° region near Indianapolis, Indiana. (b)
Bootstrapped tornado histogram during MAM Cold Event, 1.25° by 1.25° region near
Nashville, Tennessee. Back


Copyright 1999 Mark C. Bove. All Rights Reserved.