1 Center for Ocean-Atmospheric Prediction Studies, Florida State University, Tallahassee, FL
2 Oregon State University, Corvalis, OR
3 Jet Propulsion Lab., California Inst. Technol., Pasadena, CA
1. INTRODUCTION
Nearly twenty years ago, the US launched one of its first research oceanographic satellites, SeaSAT. On board SeaSAT were a variety of first-generation ocean-sensing instruments such as an altimeter (ocean height), radiometer (temperatures and humidity), and scatterometer (wind vectors over the ocean), all designed to provide previously unattainable quantity and quality of data reflecting variability of the ocean and adjoining atmospheric boundary-layer. Before its premature failure, SeaSAT provided nearly 100 days of fascinating data which gave rise to new directions for research in oceanography and air-sea interaction (e.g. Katsaros and Brown 1991). Since the SeaSAT era, technically advanced designs of the altimetric and radiometric instruments were designed and launched on numerous platforms (e.g. GeoSAT, SSM/I, and Topex).
In the 1990's microwave scatterometry is finally catching up. The Europeans have had two successive scatterometers beginning in 1991, but duty cycling and design characteristics limit coverage; and hence, application of these data. In August 1996, a unique combination of Japanese, US, and French instruments was launched aboard the Japanese satellite, ADEOS. On board ADEOS is the first dedicated microwave scatterometer since SeaSAT, NSCAT (NASA Scatterometer). This scatterometer can determine the wind speed and direction over 90% of the ice-free global water surface in two days with 25-km resolution. This unprecedented resolution of global wind data will have profound impacts on oceanographic and meteorological applications. But first, an assessment of the accuracy of NSCAT winds is required. This report describes initial efforts to establish uncertainty characteristics of NSCAT data from the calibration/validation campaign.
Uncertainty in the surface truth (at the location of the satellite observation) is reduced by restricting this analysis to coincident satellite and high quality research vessel observations. The differences in observation times are less than twenty minutes, and the differences in locations are less than 50 km. These restrictions have been made practical through the use of a new quality-controlled data set of research vessel surface meteorology observations. Observations from research ships are often recorded at one minute intervals; consequently, the satellite observations can usually be matched to within 30 seconds. Ship observations are converted to earth relative winds and averaged over the ten minutes preceding a satellite observation. Only those averages made up of five or more observations are used in the comparison. A boundary-layer model [Clayson et al., 1996; Bourassa et al., 1997] is used to adjust the averaged observed wind speed to a height of ten meters, the height for which NSCAT will be calibrated. Correction of the ship observations to correspond to an earth relative frame of reference and the standard height is critical because any errors in these in-situ speeds and directions will increase discrepancies between ship and satellite winds. These differences are used to assess the accuracy of the scatterometer winds. Wind observations from two ships, R/V Knorr and RSV Aurora Australis, provided 33 observations that were collocated with satellite observations. These observations covered a range of wind speeds (U10) from 3 to 20 m s-1.
2. QUALITY-CONTROLLED RESEARCH VESSEL DATA
The accuracy of NSCAT winds is assessed against winds observed on research vessels. Our experience has shown us that observations from ships that are routinely involved in gathering observations for scientific purposes are preferred over data from other ships. Well known characteristics of observed winds reported by Volunteer Observing Ships (VOS) are their relatively large systematic and random errors [Pierson, 1990]. These errors are due in part to incorrect transmissions of ship-relative and apparent winds instead of true (earth relative) winds (Table 1). Wind observations, from VOS and research ships, are typically reported every three hours; however, research vessels often have an additional record of high temporal resolution observations (typically 1 to 15 minute sampling intervals). These high resolution observations, along with navigational records, can easily be used to determine if the reported winds are true winds.
| Platform relative winds | ||
| Apparent winds | ||
| True winds | ||
| Ship speed and course |
Research vessel data often includes the navigational observations required to convert winds observed on a moving ship to earth relative winds. Some research vessels also collect data continuously, thus insuring a relatively large number of matchups coincident in time and space with satellite observations. Furthermore, the height and exposure of the anemometer is known on most research vessels. This height is important for determining the wind speed at the standard meteorological height of ten meters. Near the surface, wind speeds increase as height increases, and most ships' anemometers are located more than ten meters above the water surface.
One of the advantages of research vessel data is that there are sufficient data and metadata to facilitate more thorough quality-control. The World Ocean Circulation Experiment (WOCE) Data Assembly Center (DAC) for surface meteorological data at Florida State University collects, checks, archives, and distributes surface meteorological data from international WOCE vessels. This includes data from nearly-continuous recording systems. Data quality evaluation procedures have been developed and are utilized to produce value-added data sets [Smith, 1996]. If the reported winds are not true winds, and if the necessary meteorological and navigational observations are available, then true winds can be calculated. Additional tests have been developed [Smith et al., 1997] to flag observations likely to have been influenced by ship acceleration and flow distortion.
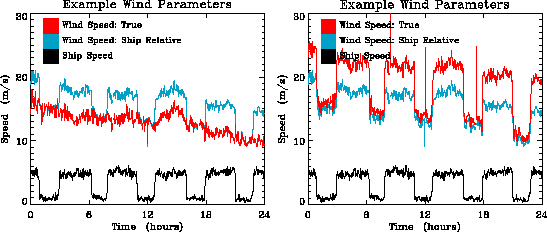
The check to determine if the reported winds are true winds is accomplished by overplotting time series (one day is usually sufficient) of the reported winds and the ship's speeds (Fig. 1). True winds should be independent of the ship's speed. Research vessels often undergo large changes in speed: they cycle between periods of cruising to oceanographic observations sites and periods of observations where the ship is nearly stationary. If there are substantial differences (U > 0.5 m s-1) in the mean reported winds before and after the ship changes speed, then these winds are unlikely to be true winds. Similarly, times at which instruments fail can be identified. For example, the R/V Knorr's ship speed and true wind were too well correlated (|r| > 0.25; compared to prior values of |r| < 0.07) after Nov. 15, 1996, indicating a failure of the wind observing system. Instrument failures and errors in calculations and are readily apparent in visual inspections of the time series of ship speed and reported wind speed. Our experience in quality-controlling wind observations has shown us that a large fraction of research vessels either do not report true winds or report incorrect 'true' winds; however, given appropriate navigational data, true winds can be calculated from the observations.

Fig. 1. Time series of smoothed
reported wind speed (dotted line) and ship speed (dashed line)
from the R/V Knorr (Nov. 10, 1996) for (a) correctly calculated
true winds, and (b) incorrectly calculated true winds.
2.1 Calculation of True Winds
True winds (UT) can be calculated from ship winds by removing the wind component that has artificially been introduced by the motion of the ship. Examination of WOCE wind reports indicates that a common error is to subtract the motion of the ship (US) from the apparent wind (UA); that operation has the wrong sign, and doubles the change induced by ship motion. The correct vector relation is
This calculation requires the apparent wind, the ship's speed, and the ship's course. If the reported wind is platform relative, rather than apparent, then the ship's heading is also required to convert from a platform relative direction to a direction with respect to North. Of the two ships used in this study, one provided correct true winds, and the other provided sufficient information to determine true winds.
3. NSCAT DATA
NSCAT was launched on the polar orbiting ADEOS satellite and began measuring wind speeds on Sept. 15, 1996. NSCAT is an active microwave sensor, which measures the return signals from 600 km wide swaths on both sides of the satellite. The resolution within the swaths is approximately 25 km. The microwaves are Bragg scattered by short water waves; the fraction of energy that returns to the satellite (backscatter) is a function of wind speed and wind direction. Each swath is sampled by fore, mid, and aft beams; each of which samples from different directions. Wind speeds and directions are calculated where there are radar observations from at least two of these beams.
Scatterometers are unique among satellite remote sensors in their ability to determine the wind direction. The wind direction is found by determining the angle that is most likely to match the observed backscatters. The function describing the fit usually has multiple minima (ambiguities). Ideally, the best fit corresponds to the direction the wind is blowing, the next best fit is in approximately the opposite direction, and the next two minima are in directions roughly perpendicular to the wind direction. The process of choosing the direction is called ambiguity selection. Noise can change the quality of fit and thereby cause incorrect directions (also known as aliases) to be chosen. The use of three antenna pre side (ERS scatterometers use only two antenna) improves the likelihood that the selected ambiguity is the correct direction. Preliminary testing of new algorithms, developed by Freilich and Wentz [personal communications, 1997], indicates that the fraction of incorrect aliases will be substantially reduced in the near future.
4 RESULTS
There were 33 collocations, with wind speeds from 3 to 20 m s-1, that met all of the quality-control criteria. The R/V Knorr was operating in the North Atlantic Ocean from Oct. 25 to Dec. 5, 1996, and the RSV Aurora Australis was in the Southern Ocean from Sept. 26 to Nov. 23, 1996. Both of these regions tend to have strong westerly winds. The RSV Aurora Australis was in ice, where waves do not respond to wind in the same manner as the open ocean, for six weeks. The number of collocations was further reduced because the R/V Knorr's wind observing system failed on Nov. 15. The time when quality-controlled collocations could be found was reduced to five ship-weeks, resulting in approximately one collocation per ship-day.
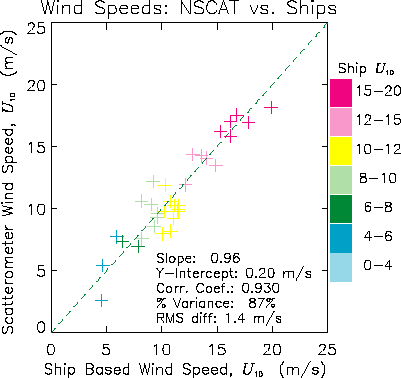
The NSCAT winds are compared to ship true winds in Fig. 2. The close fit to the dashed line shows that there is an extremely good match. The root mean square (rms) difference between NSCAT speeds and observations is 1.4 m s-1. Over the observed range of wind speeds, there is no indication of a systematic bias. Preliminary comparisons between VOS and NSCAT winds found that the rms differences between NSCAT and VOS wind speeds were roughly three times as large as the differences with our quality-controlled ship winds [personal communications, R. Atlas; V. Zlotnicki, 1997]. A similar problem is found in the GTS reports from research vessels [personal communication, V. Zlotnicki, 1997].

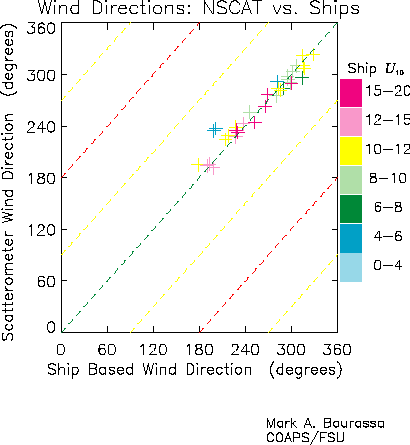
Fig. 3. NSCAT wind direction
versus ship direction of true wind for NSCAT winds. The green
dashed line indicates a perfect fit, and the red dashed lines
indicate differences of 180.
Scatterometers are unique among satellite-based wind sensors, in that they determine the wind direction as well as the wind speed. A scatterplot (Fig. 3) of scatterometer wind direction versus ship wind directions, shows that there is usually a close match. Points close to the green line indicate a good fit, and the red lines indicate reversed wind directions. our comparison has no incorrectly chosen aliases; however, comparisons against other in-situ wind observations [personal communications, R. Atlas; N. Ebuchi; S. Dunbar; H. Graber; K. Kelly and M. Caruso; R. Milliff, P. Niiler, and W. Large; V. Zlotnicki, 1997] found that approximately 90% of NSCAT winds have the correct alias. The chance that an incorrect alias is selected is dependent on wind speeds. For U10 > 8 m s-1, the chance of an incorrect alias is small; however, for U10 < 8 m s-1, the chance of an incorrect alias increases as the wind speed decreases. The rms difference between our collocated wind directions 12. This uncertainty is well under the design specifications of 20, and it may improve when the ambiguity selection is improved.

Fig. 3. NSCAT wind direction
versus ship direction of true wind for NSCAT winds. The green
dashed line indicates a perfect fit, and the red dashed lines
indicate differences of 180.
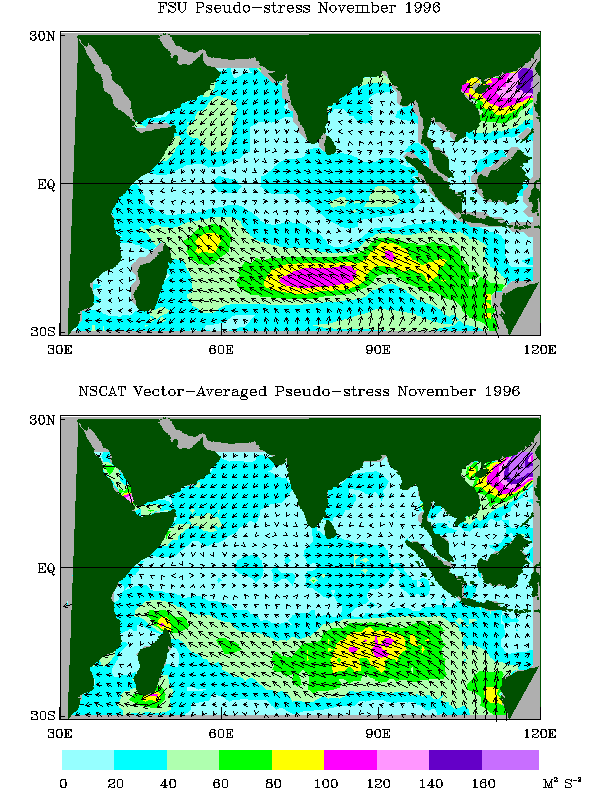
The impact of ambiguity selection on monthly average winds was
examined in a comparison of NSCAT derived pseudo-stress to the
FSU pseudo-stress fields [Stricherz et al., 1993] for the
Indian Ocean (Fig. 4). FSU pseudo-stresses are often used to
force ocean models, which is expected to be a common application
of the NSCAT observations. The pseudo-stress vector is defined
as a (UW, VW), where U and V are the
east-west and north-south components of the wind, and W
is the speed. All NSCAT wind observations were converted to pseudo-stress
and binned in 1 degree by 1 degree boxes (the FSU pseudo-stress field was constructed
in a similar manner). The FSU product is based on only in-situ
data; it is the result of a variational objective analysis technique
[Legler et al., 1989]. The psuedostress is vector averaged;
therefore, winds with incorrect ambiguity selections are averaged
with winds with correctly selected ambiguities, which results
in slower average NSCAT winds and errors in directions. The patterns
and the magnitudes are similar, even in regions of low wind speeds,
indicating that the ambiguity selection problem does not result
in a severe degradation of monthly averaged winds.

Fig. 4. Mean pseudo-stress during
Nov. 1996 for (a) NSCAT winds, and (b) FSU winds. The arrows
indicate the direction of the psuedostress, and the contours indicate
the pseudo-stress magnitude. The data are binned on a 1 degree
mesh, but vectors are drawn every 2 degrees for convience.
5. CONCLUSIONS
Quality-controlled and high temporal resolution wind observations from research vessels have proved to be effective in providing surface truth to evaluate the accuracy of NSCAT winds. The NSCAT scatterometer works well within the design specifications of 2 m s-1 uncertainty in speed, and 20 in the direction of correctly chosen aliases: the differences in comparisons to high quality in-situ observations are 1.4 m s-1 and 12. The ambiguity selection technique was 100% effective with our data set. Monthly averaged pseudo-stress based on NSCAT winds is a good match to in-situ (FSU) pseudo-stress: the ambiguity selection problem for low wind speeds does not cause large errors in monthly mean fields. The improved model functions being developed by Freilich and Wentz are expected to be tested by April 1997, and preliminary testing indicates that these model functions could result in substantial improvements in ambiguity selection. NSCAT winds appear to be sufficiently accurate for use in forcing ocean models.
Acknowledgments. We thank Barrie Walden and Lane Abrams for providing observations from the R/V Knorr, Kieran Jacka and Gordon Keith for providing observations from the RSV Aurora Australis, and Shawn Smith, Dan Gilmore, and Jiraporn Whalley for quality-controlling the ship data. Funding for this project is from the NASA JPL NSCAT Project. COAPS receives its base funding from ONR's Secretary of Navy Grant to Dr. James J. O'Brien.
REFERENCES
Bourassa, M. A., D. G. Vincent, and W. L. Wood, A flux parameterization including the effects of capillary waves and seastate, J. Atmos. Sci., submitted, 1997.
Clayson, C. A., C. W. Fairall, J. A. Curry, Evaluation of turbulent fluxes at the ocean surface using surface renewal theory, J. Geophys. Res., 28,503 - 28,513, 1996.
Katsaros, K. B., and R. A. Brown, 1991: Legacy of Seasat mission for studies of the atmosphere and air-sea-ice interactions. Bull. Amer. Meteor. Soc., 72, 967-981.
Legler, D. M., I. M. Navon, and J. J. O'Brien, Objective Analysis of pseudo-stress over the Indian Ocean using a direct minimization approach, Monthly Weather Review, 117, 709-720, 1989.
Pierson, W. J., Jr, Examples of, reasons for and consequences of the poor quality of wind data from ships for the marine boundary layer: implications for remote sensing, J. Geophys. Res., 13,313 - 13,340, 1990.
Smith, S. R., C. Harvey, and D. M. Legler, Handbook of quality control procedures and methods for surface meteorology data, WOCE Report No. 141/96, 49pp., 1996.
Smith, S. R., M. A. Bourassa, and R. J. Sharp, True winds from vessels at sea: Requirements and implications for automated maritime observing systems, J. Atmos. Oceanic. Technol., to be submitted.
Stricherz, J. N., D. M. Legler, and J. J. O'Brien, Atlas of Florida
State University Indian Ocean Winds for TOGA 1970-1985, Florida
State University, Tallahassee, FL, 250 pp., 1993

Last Updated April 14, 1997