ESPC-HYCOM GLBb0.08 vs. GLBt0.72
Experimental set-up: HYCOM+CICE+NAVGEM
-
• GLBt0.72 (gh72): 0.72º (~75km) tripolar grid for Ocean and Ice and a T119 (~1º) grid for the Atmosphere and Land
-
• GLBb0.08 (gh08): 0.08º (~8km) tripolar grid for Ocean and Ice and a T319 (~0.3º) grid for the Atmosphere and Land
-
• Start from rest with the GDEM4 Climatology for the Ocean component and a constant cover/thickness in the Arctic and Antarctic for the Ice component
-
• HYCOM: 32 hybrid sigma-2 layers, NAVGEM: 26 levels, CICE: 5 categories
-
• No relaxation of sea surface temperature or salinity in HYCOM
-
• Simulation of 5 years in high resolution to be compared with 15 years of low resolution
-
• Both Resolutions are run with full flux exchange between Ocean and Ice.
-
• Start date: Nov 2011 (2016 == Year 0005)

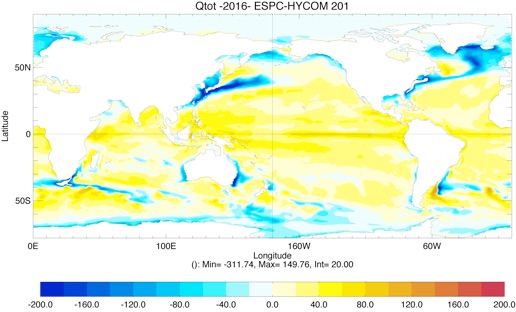
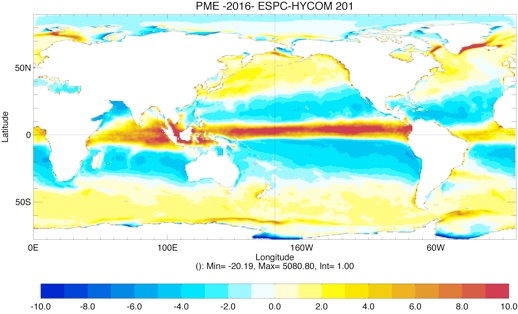
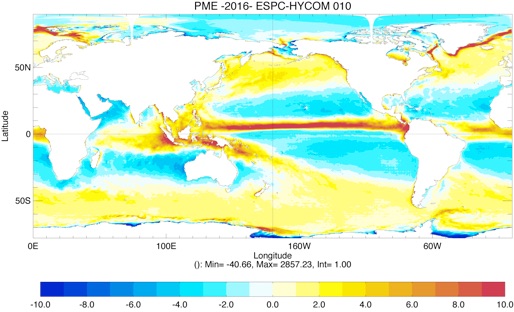
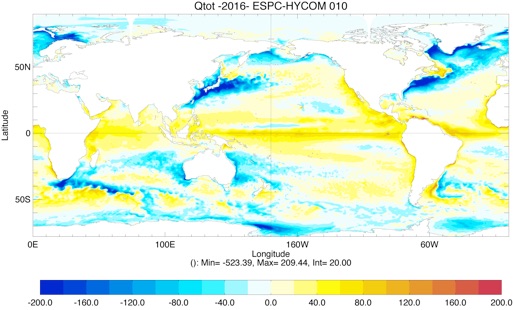
Surface Heat and Freshwater Flux
GLBt0.72
GLBb0.08


-
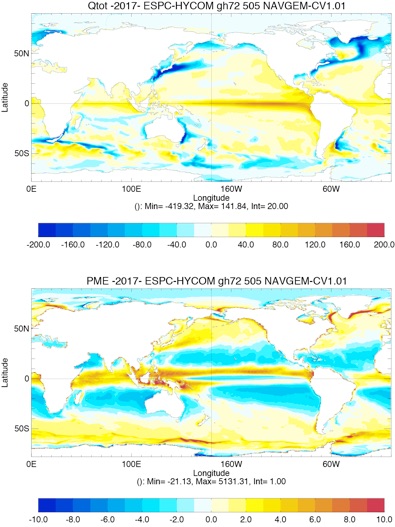
✓ Similar features in GLBt0.72 and GLBb0.08 with strong heat loss over western boundary currents and North Atlantic sub polar gyre, heat gain along the equator.
-
✓ GLBb0.08 colder/more neutral in North and South Pacific gyres, south Indian Ocean.
-
✓ Similar feature in freshwater flux. Biggest difference in West Pacific.
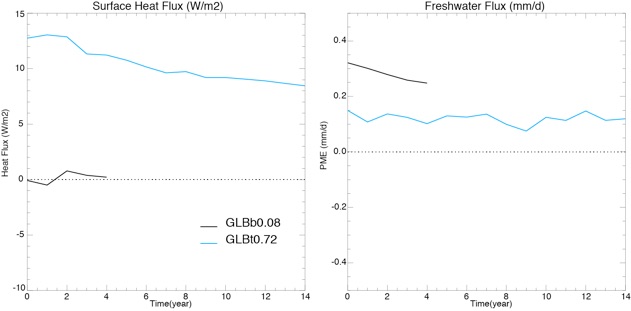
Evolution of total average Heat and Freshwater Flux
-
✓ Higher surface heat flux in low resolution.
-
✓ Higher freshwater flux in higher resolution.
-
✓ Average Heat Flux:
-
• GLBt0.72: 10.3 ± 1.6 W/m2
-
• GLBb0.08: 0.16 ± 0.5 W/m2
-
✓ Average Freshwater Flux:
-
• GLBt0.72: 0.12 ± 0.02 mm/d
-
• GLBb0.08: 0.28 ± 0.03 mm/d
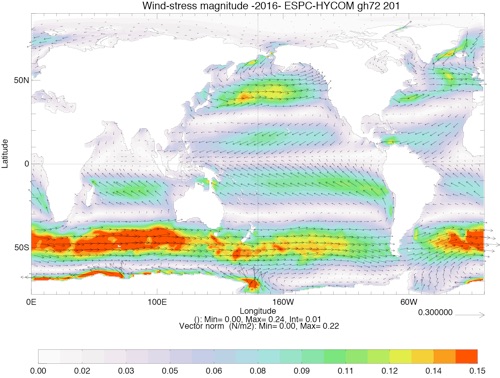
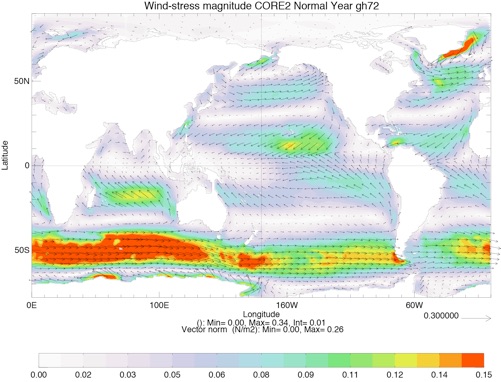
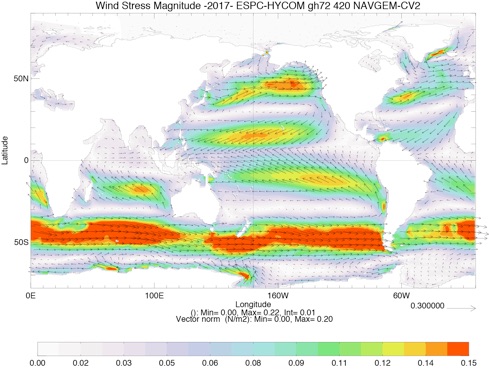
Wind Stress Magnitude
GLBt0.72
GLBb0.08
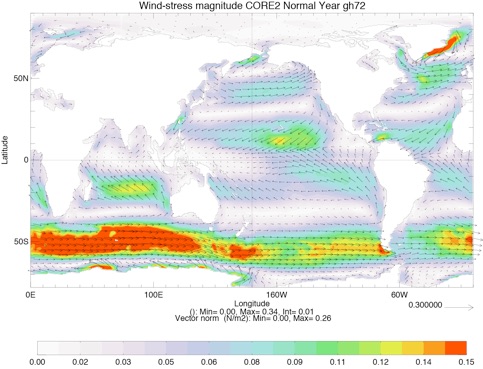
CORE2 Normal Year on GLBt0.72 grid
-
✓ Over estimation over North Pacific in gh72.
-
✓ Inaccurate representation of wind patterns in Equatorial/South Pacific
Evolution of T,S,SST,SSS and SSH
-
✓ Global T increases more rapidly in GLBt0.72 due to the bigger heat flux imbalance.
-
✓ Slight decrease of global S in both GLBt0.72 and GLBb0.08 due to the positive averaged freshwater flux.
-
✓ Higher decrease of Global S in GLBb0.08
SST and SSS Bias from Climatology
GLBt0.72
GLBb0.08
-
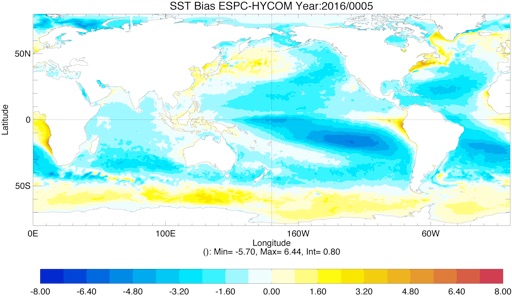
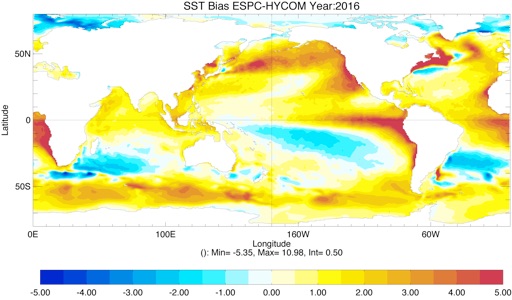
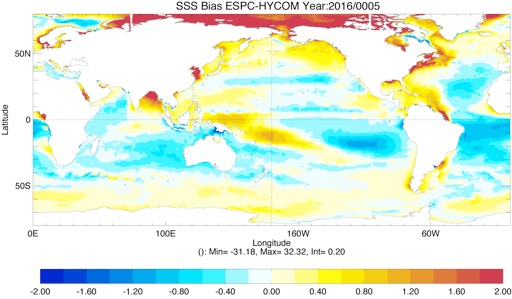
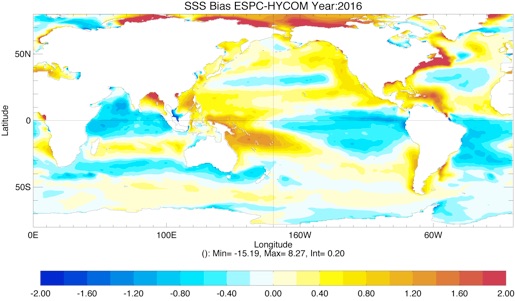
✓ Spatial biases different between GLBt0.72 and GLBb0.08.
-
✓ Reverse bias in SST in GLBb0.08 compared with GLBt0.72.
-
✓ Less SSS biases in GLBb0.08 overall, except for the Arctic region (ice differences).


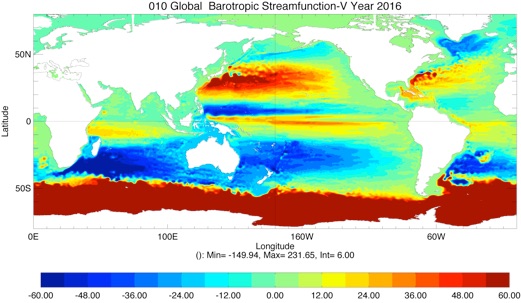
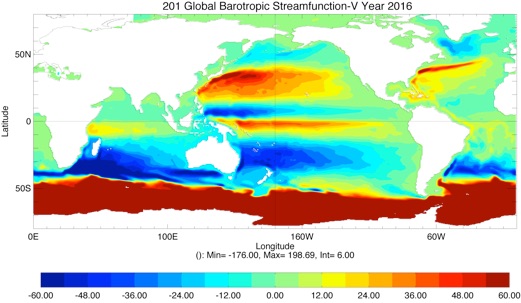
Barotropic Streamfunction
GLBt0.72
GLBb0.08
-
✓ Stronger circulation in the North Atlantic in GLBb0.08.
-
✓ Better representation of the circulation around in the Gulf of Mexico region in GLBb0.08.
-
✓ Better representation of the Gulf Stream.
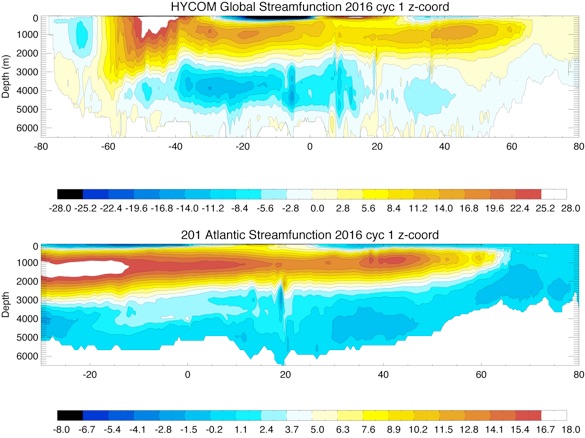
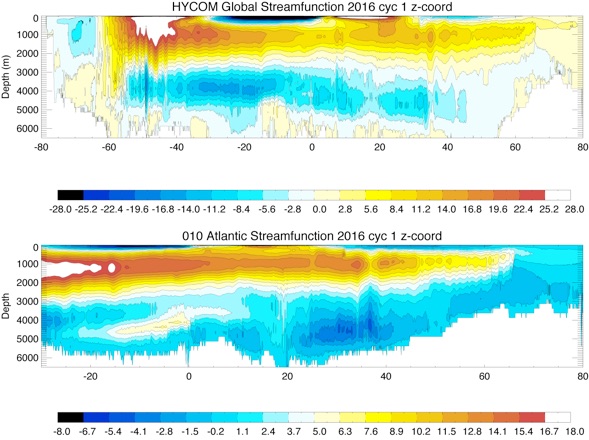
GMOC and AMOC
GLBt0.72
GLBb0.08
-
✓ Slightly stronger circulation in the lower resolution.
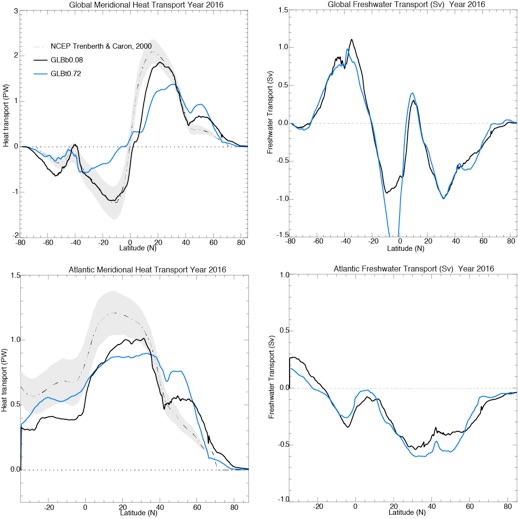
Meridional Heat and Freshwater Transports
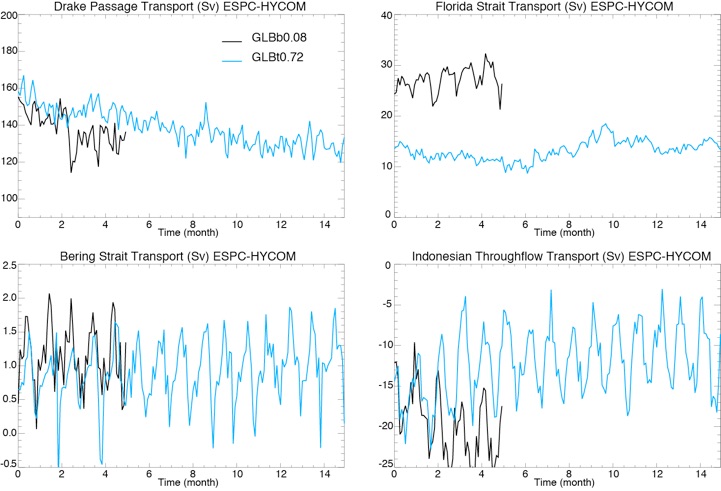
Transports at several sections
-
✓ Similar transports in GLBt0.72 and GLBb0.08 (unlike CESM) at the Drake Passage, but transport decreasing.
-
✓ Similar transports at Bering
-
✓ Stronger transport in GLBb0.08 at Florida Straits since most of the transport by-passed the Gulf of Mexico in the low resolution.
-
✓ Stronger Indonesian Throughflow in GLBb0.08 but similar interannual variability
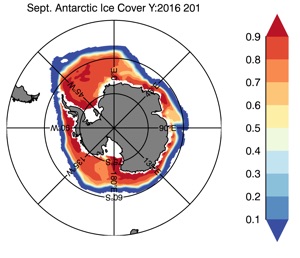
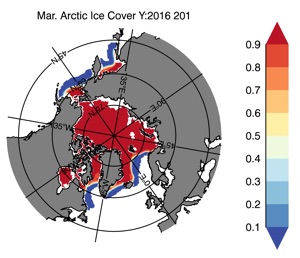
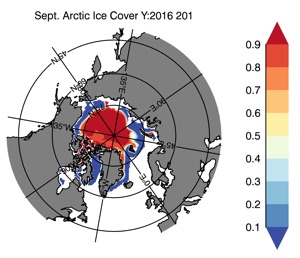
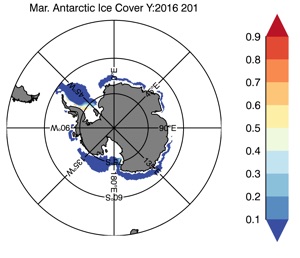
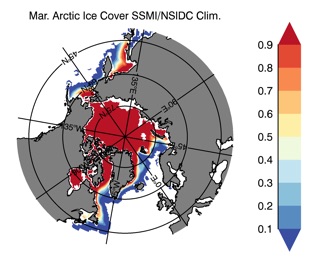
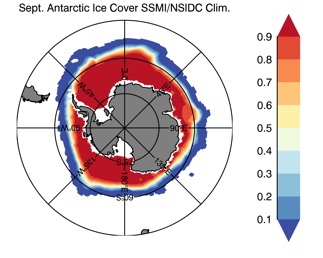
Ice Cover
Winter
GLBt0.72
GLBb0.08
SSMI/NSIDC
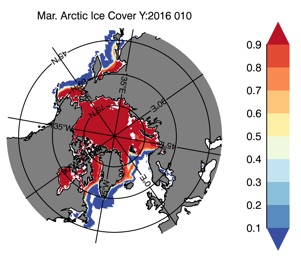
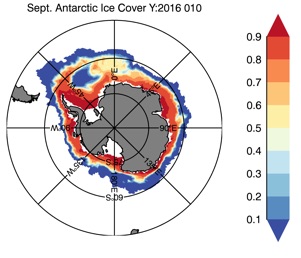
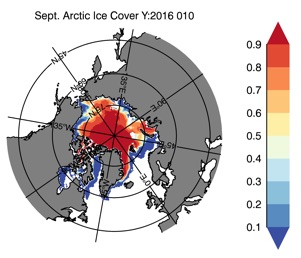
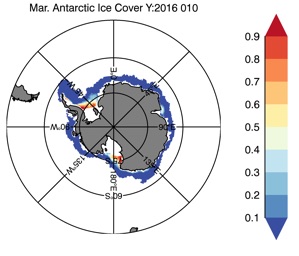
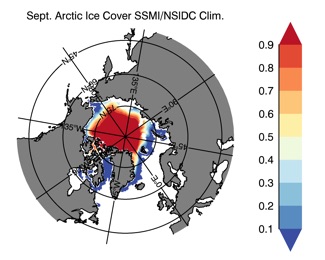
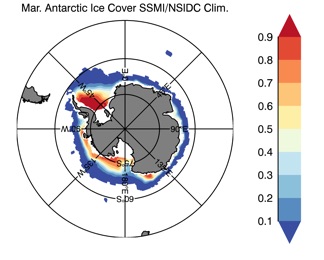
Summer
GLBt0.72
GLBb0.08
SSMI/NSIDC
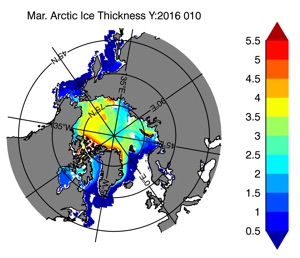
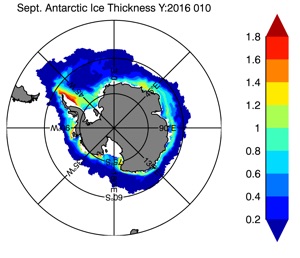
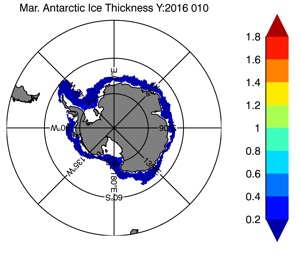
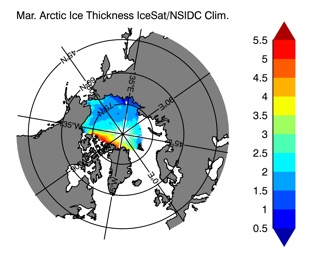
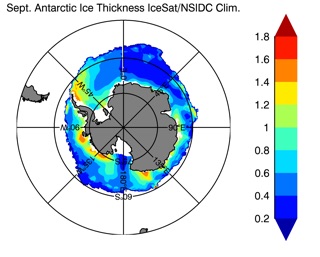
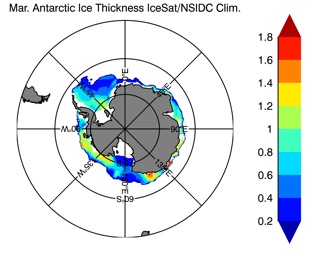
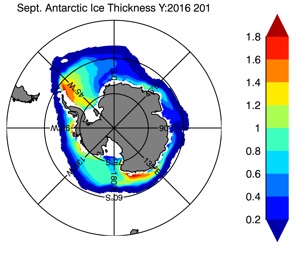
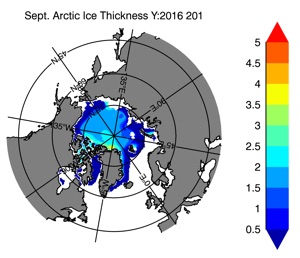
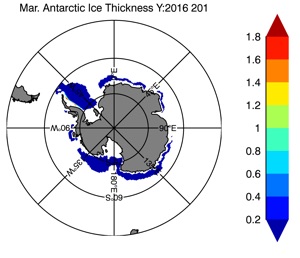
Ice Thickness
Winter
GLBt0.72
GLBb0.08
IceSat/NSIDC
Summer
GLBt0.72
GLBb0.08
IceSat/NSIDC
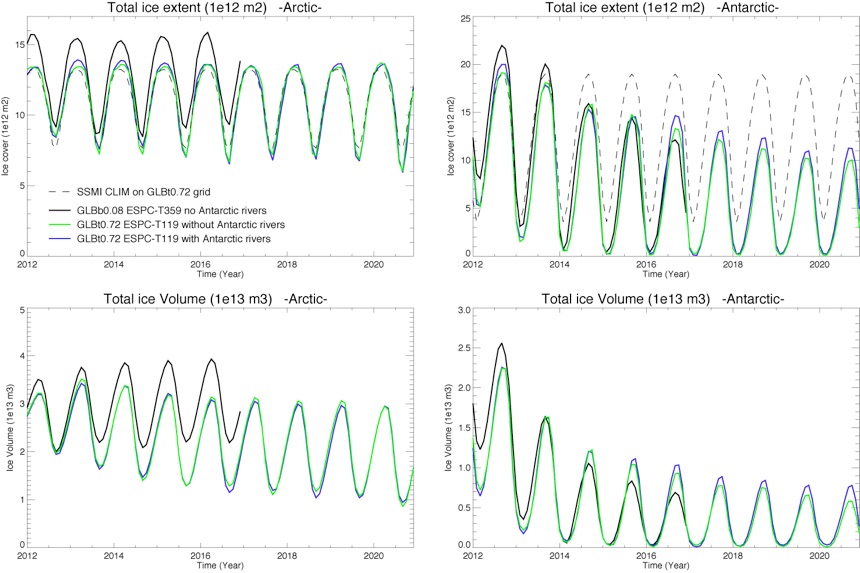
Test Antarctic rivers GLBt0.72
201: ESPC-T119 GLBt0.72 with Dai and Trenberth (2002) rivers, including constant rivers for the Antarctic (~2300Gt/y)
203: ESPC-T119 GLBt0.72 with Dai and Trenberth (2002) rivers but no rivers for the Antarctic.
Not Available
Vertical Streamfunctions

-
✓ Comparable strength of AMOC in low and high resolution.

-
✓ Stronger global heat transports in the mid-latitudes for high resolution GLBb0.08.
-
✓ Similar Freshwater transport at both resolutions and in both basins.
-
✓ GLB0.08 Heat flux closer to NCEP Trenberth and Caron (2000).
NB: New Heat flux estimates by Trenberth and Fasullo 2008 is lower than Trenberth and Caron 2000



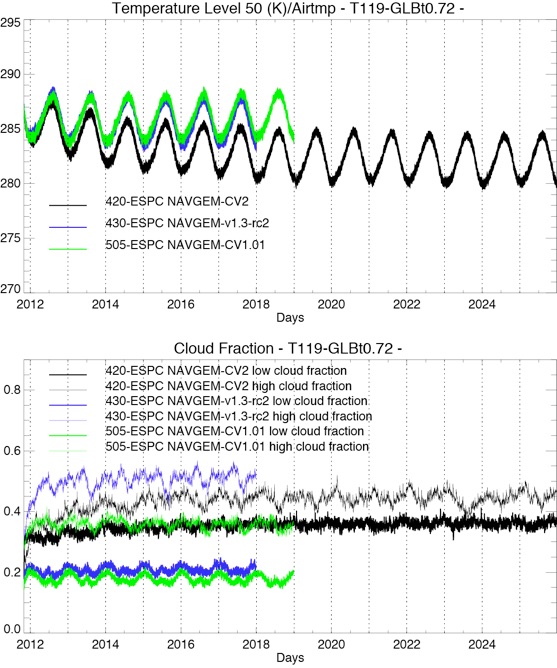
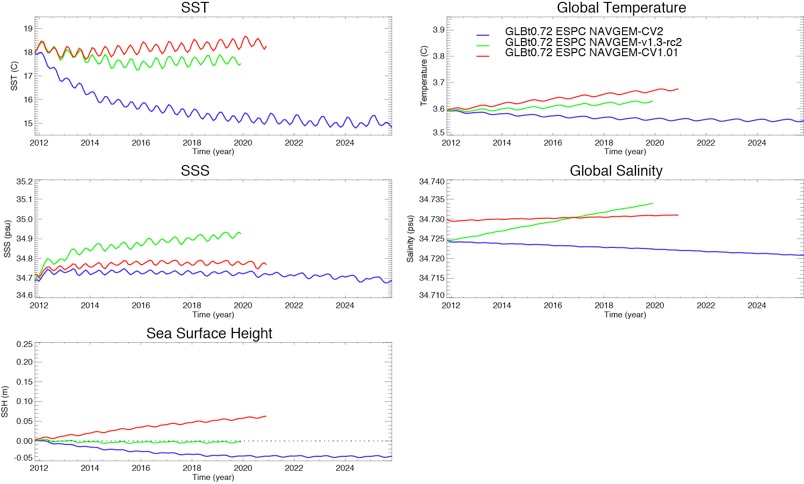
Comparison of NAVGEM versions with GLBt0.72
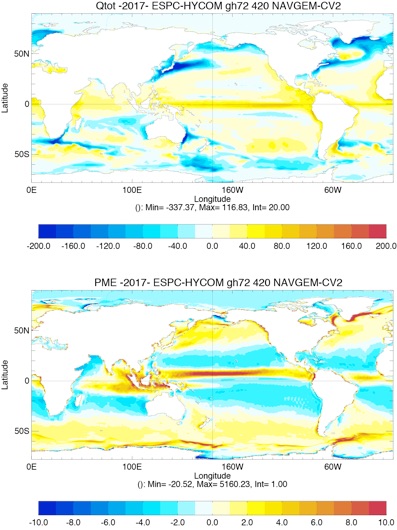
420: T119-glbt072 with NAVGEM-CV2
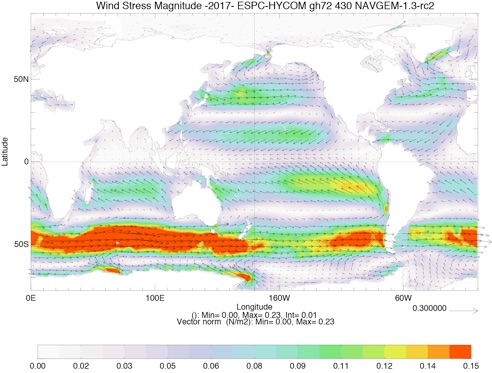
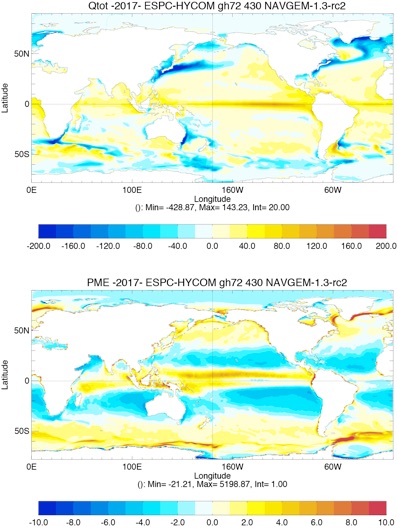
430: T119-glbt072 with NAVGEM-v1.3-rc2
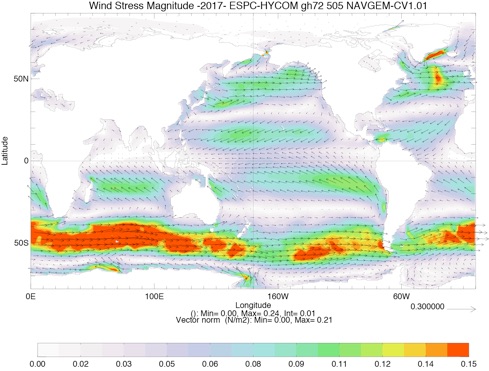
505: T119-glbt0.72 with NAVGEM-CV1.01

Comparison of GLBb0.08/GLBt0.72 with CICE bugfix
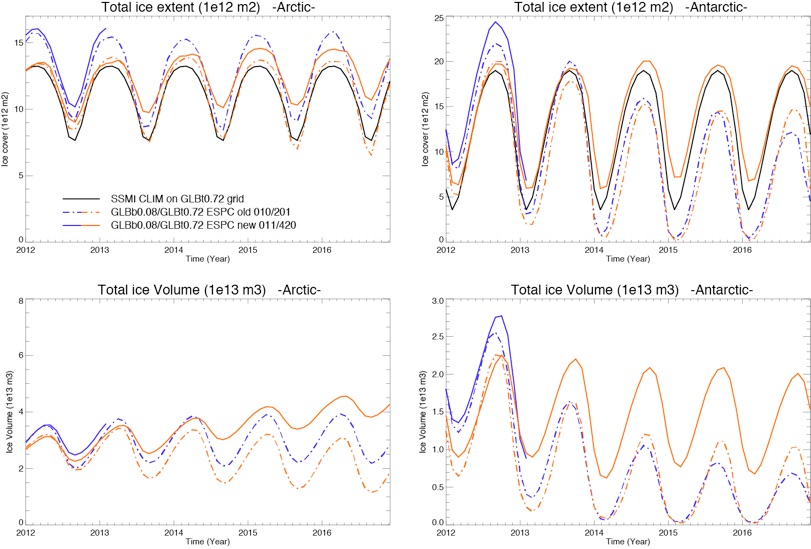
GLBb0.08 in blue (new in plain and old in dashed)
GLBt0.72 in red (new in plain and old in dashed)
For both less melt in the summer ...
Ice extent and thickness:
-
✓ Difference of behavior depending on NAVGEM version.
T and S :
-
✓ Strong decrease of SST with NAVGEM-CV2
Air temperature and Cloud Fraction :
-
✓ Progressive decrease of air temperature with NAVGEM-CV2
-
✓ Cloud fraction very different between version
Wind-stress and surface Heat flux and freshwater flux :
-
✓ Different strength of wind-stress between versions
-
✓ Different freshwater flux between versions
NAVGEM-CV2
NAVGEM-1.3-rc2
NAVGEM-CV1.01
CORE2 Normal Year
Comparison of GLBb0.08/GLBt0.72 with ESPC:
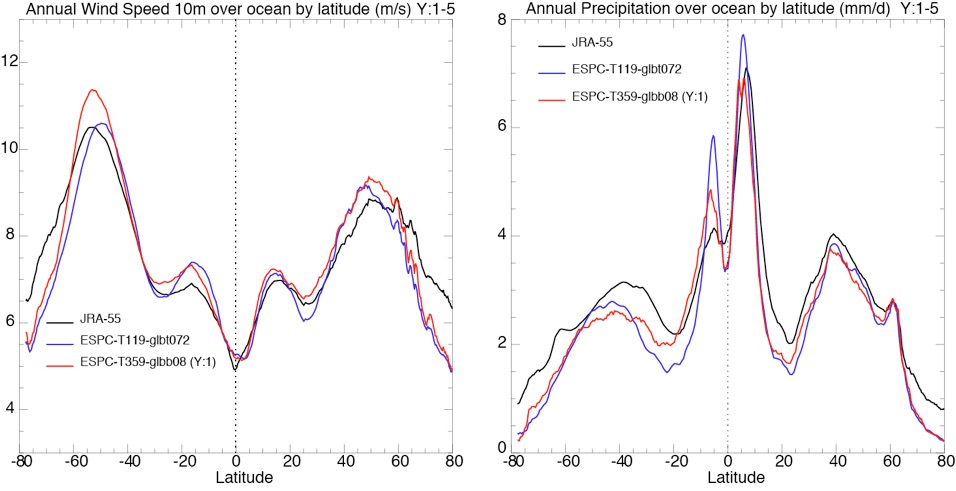
ESPC-T119-glbt072:
-
✓ dt=900s since 360s gives a SST that decreases sharply in the first year.
-
✓ Atm: NAVGEM-CV3: c00=9.5e-4, g00=8.5e-4, ck1=0.5, ck2=45., ck3=0.70
-
✓ Ice : CICE4 modified mu_rdg, ustar_scale, cp_ocn, albedo and CICE5 weight albedos
ESPC-T359-glbb008:
-
✓ dt=360s -> SST decreases sharply in the first year.
-
✓ Atm: NAVGEM-CV2: c00=1.0e-3, g00=7.0e-4, ck1=0.5, ck2=45., ck3=0.64
-
✓ Ice : CICE4 and CICE5 weight albedos
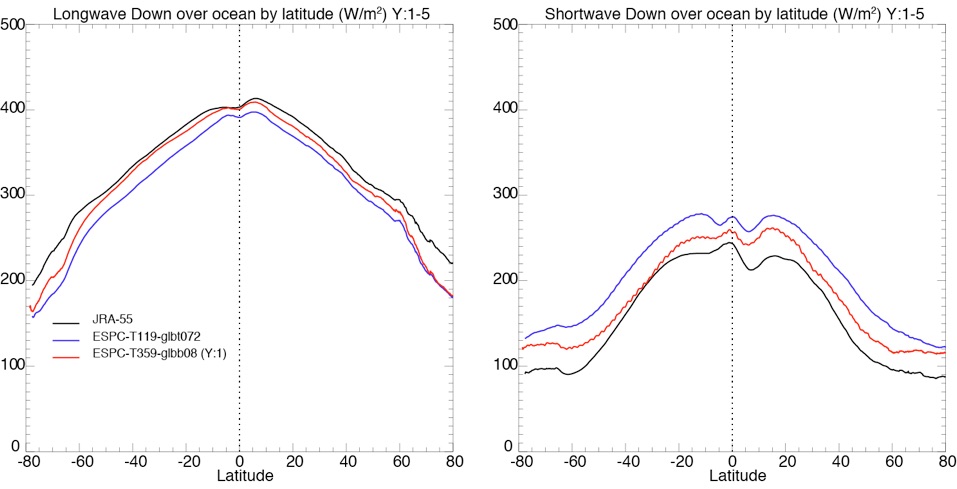
Latest results on sensitivity tests of cloud parameters in T119 and T359
Several tests have been performed to improve the atmospheric variable going into HYCOM, namely: longwave down, shortwave down, 2m air temperature and 2m Specific humidity
Comparison is done against ERA-INTERIM 1979-2015.
All simulations are coupled with GLBt0.72 HYCOM.
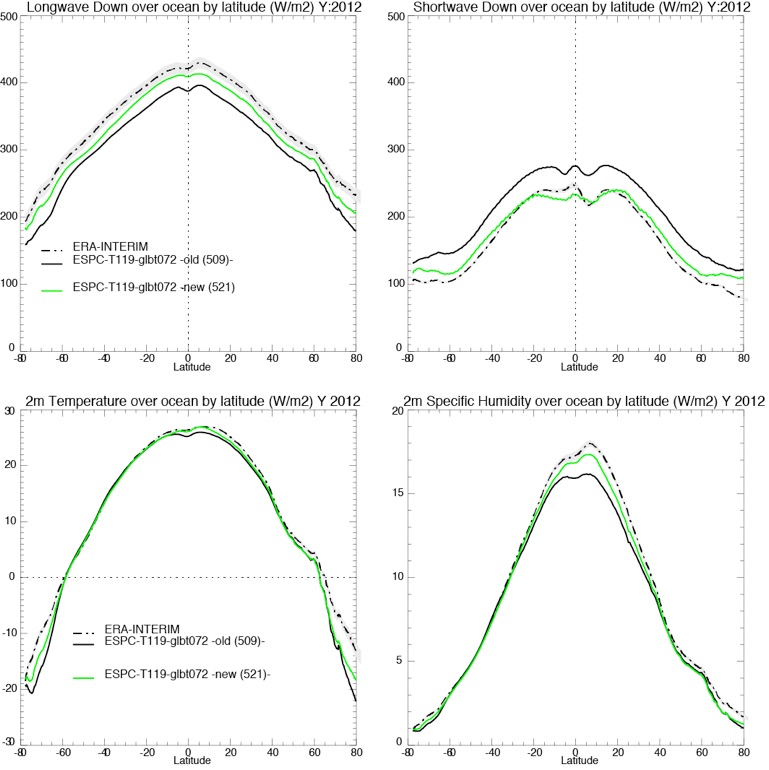
T119
The latest simulation gives an improved atmosphere but the SST is still decreasing over the first two year (-0.5ºC). Tests are still on-going to get a more stable SST.
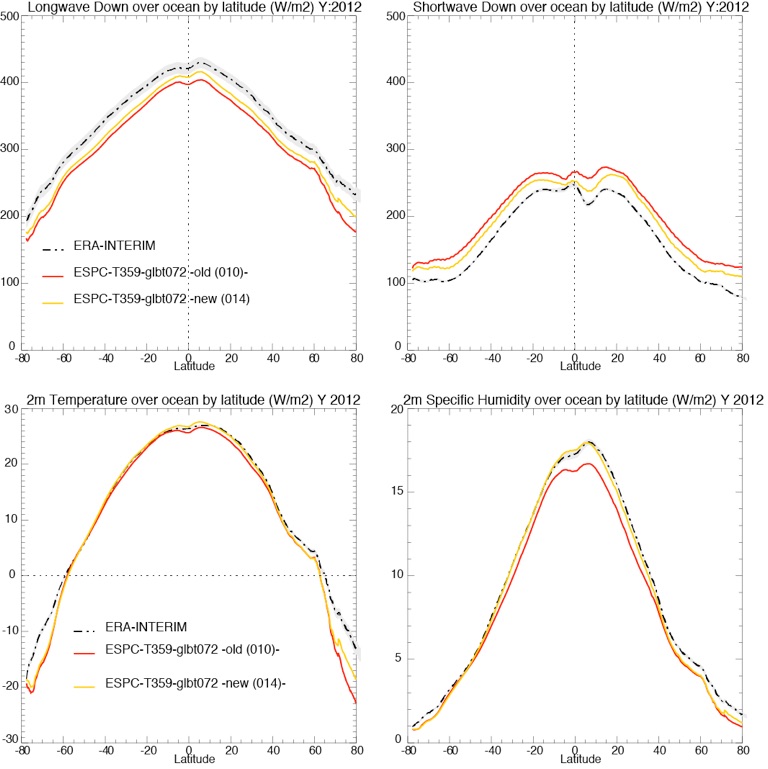
T359
In the latest simulation, the longwave is increased and the shortwave is decreased but they still show a significant biases. The 2m air temperature and specific humidity is however greatly improved except in the polar regions. The SST is slightly increasing over the 2 years of simulations.
Results of the CESM for high and low resolutions
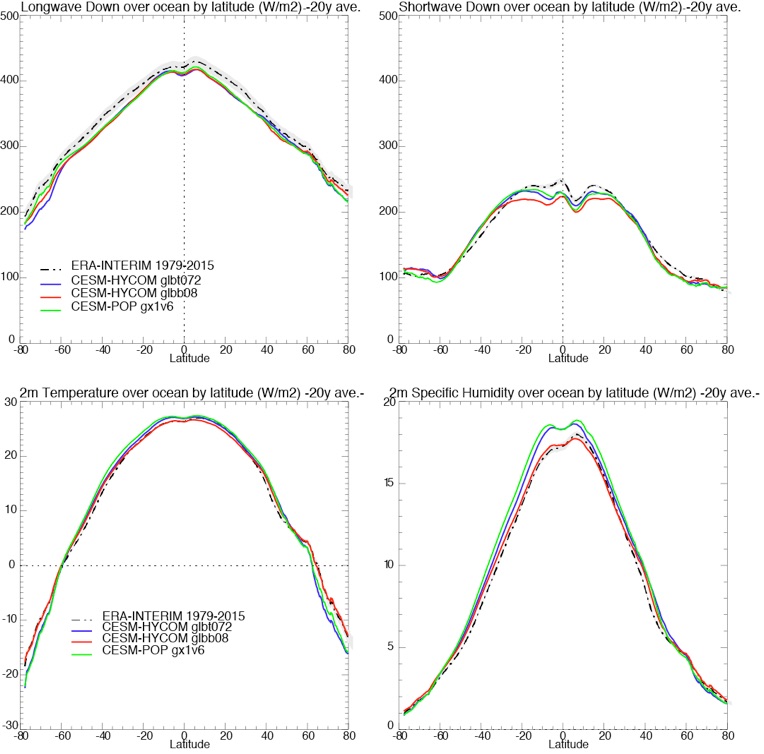
The CESM configuration discussed here are:
-
✓ CESM-HYCOM GLBt0.72 (~3/4º tripolar grid)
-
✓ CESM-HYCOM GLBb0.08 (1/12º tripolar grid)
-
✓ CESM-POP gx1v6 (1º bipolar grid)
All results are averages over the first 20 years.
In CESM, we see:
-
✓ similar bias in longwave down as in ESPC.
-
✓ shortwave down close to observations with underestimation in the tropical regions.
-
✓ slight overestimation of 2m temperature except on the polar regions in the low res. Close to observations for the high resolution.
-
✓ Overestimation in the tropics of the specific humidity in the low res, very close to obs. for high res.