Florida Current

-
• Structure of the Florida Current at 27ºN
From Leaman et al. (1987)

-
• Cross section of average east (a) and north (b) velocity component at 27ºN between Apr 1984 and Jul 1984.
-
• Structure of the Florida Current at 27ºN in HYCOM
From experiment 74.2, HYCOM 1/12º Global configuration with assimilation.
Monthly Field from the period Jun 2007 to Oct 2010:
Spreadsheets :
Ex:
449 01 19812.2 1032.97 0.091594 3.84E-01 7.61E+03
correspond to
index i (east-west), index levels, area, density, velocity (>0 northward), power density, power density*area
2007:
2008:
2009:

• Power Density (Watt/m2) of the Florida Current at 27ºN in HYCOM (expt_74.2)
P=0.5*rho*U3
Monthly Field from the period Jan 2008 to Sep 2009:


Monthly Northward velocity (m/s) for 2008 at 27ºN
Monthly Power density (W/m2) for 2008 at 27ºN
-
• Transport at 27ºN (1Sv = 106 m3/s)
Comparison between monthly field of Obs (Cable), HYCOM expt_74.2 and HYCOM expt_74.2 + 10% velocity
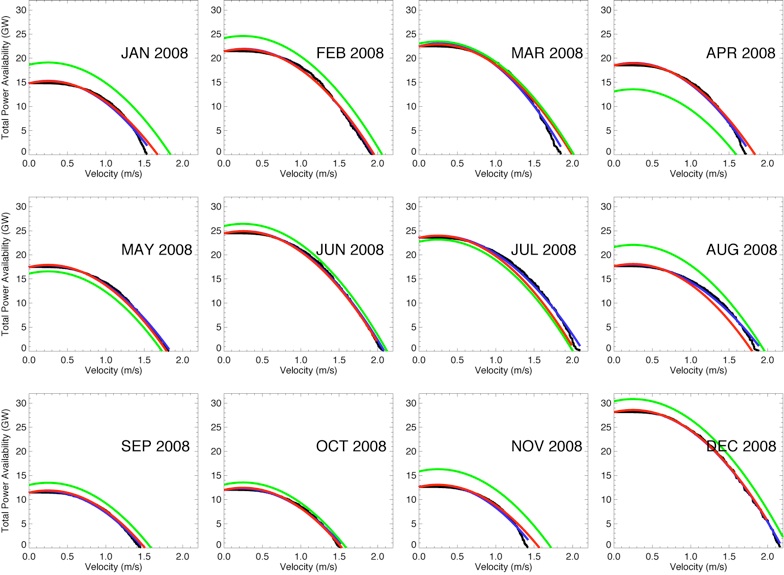
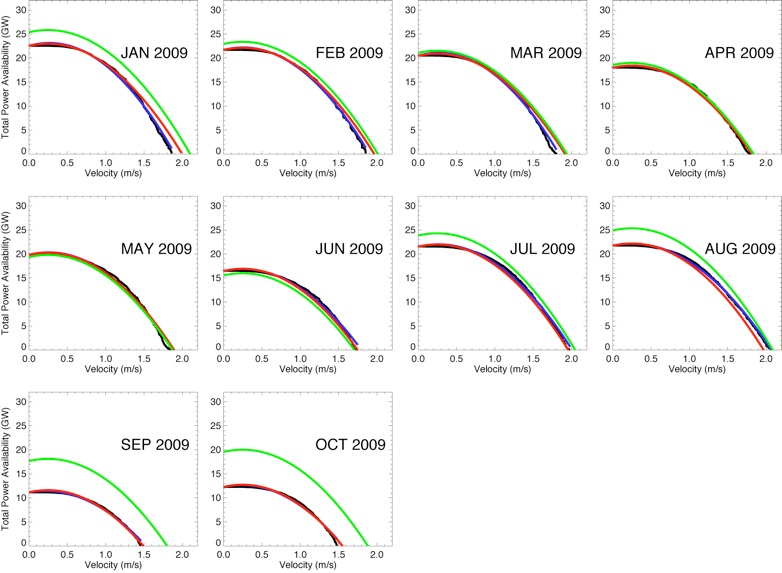
Total Power Availability (GW = 109 Watts) from Jun 2007 to Oct 2009 with respect to the velocity
Total Power availability vs Transport at 27ºN (1Sv = 106 m3/s) for values from 2008 and 2009 of HYCOM expt_74.2 +10%. ( Ptot = a* Trtot +const )
For HYCOM expt_74.2
Ptot = 1.42*Tr - 25.61
For HYCOM expt_74.2 + 10%
Ptot = 1.72*Tr - 34.08
The HYCOM results of total Power availability (P) can be expressed as a function of the meridional velocity (U) with a 2nd order regression as : P= aU2 + bU +c (black lines vs. blue lines) with c total power.
Values of a (top) and b (bottom) for each month from June 2007 to Oct 2009.
-
✓ The average a is -6.81 and b 3.07.
P=-6.81*U2 +3.07*U + Ptot


Total Power Availability (GW = 109 Watts) from Jun 2007 to Oct 2009 with respect to the velocity for HYCOM+10%, regression and from the Cable

Values of a (top) and b (bottom) for each month from June 2007 to Oct 2009
HYCOM +10%.
-
✓ The average a is -7.50 and b 3.71.
P=-7.50*U2 +3.71*U + Ptot


Total Power Availability (GW = 109 Watts) from Jun 2007 to Oct 2009 with respect to the velocity from the Cable data.
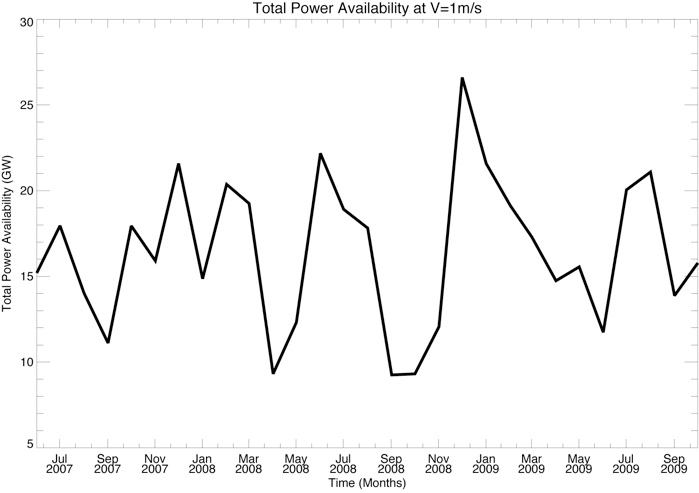

Evolution of the Total Power Availability (GW = 109 Watts) for V=1m/s.
