Tides in the Gulf of Mexico

Nodal Corrections........
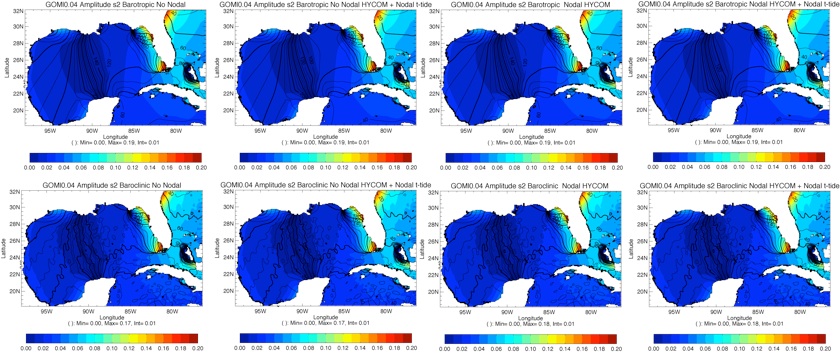
Here we used the GOMl0.04, NO TIDAL DRAG (cbar=0.05) and TIDSAL=0.
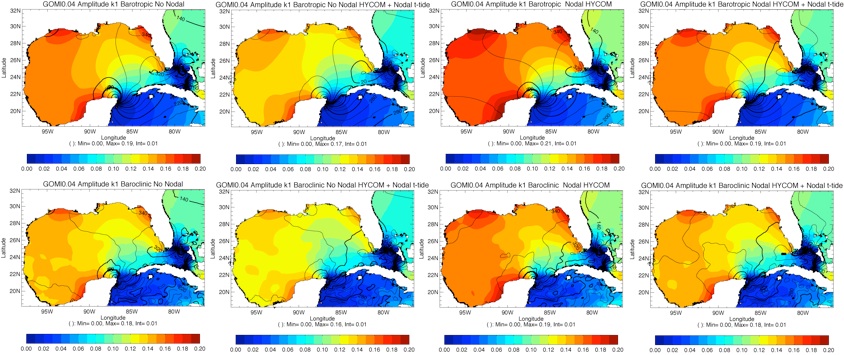
Two ways to apply Nodal corrections: 1) directly inside HYCOM at each time step or 2) with t-tide after the end of the simulation. In the second case, T-tide takes the middle of the SSH time-series as a time reference for the nodal corrections.

FOR O1:


NO NODAL
NO NODAL HYCOM + Nodal T-TIDE
NODAL HYCOM
NODAL HYCOM+Nodal T-TIDE
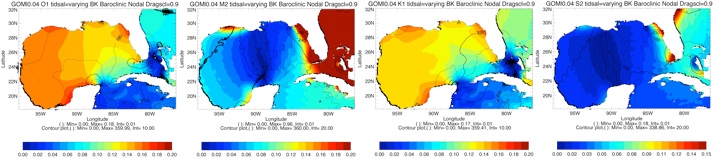
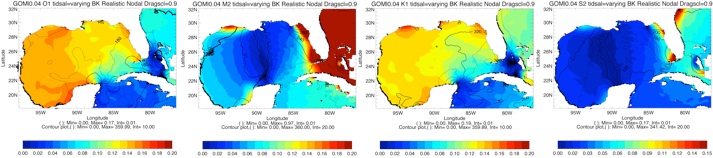
TIDSAL, quadratic bottom drag (cb) and topographic wave drag (TIDAL DRAG)
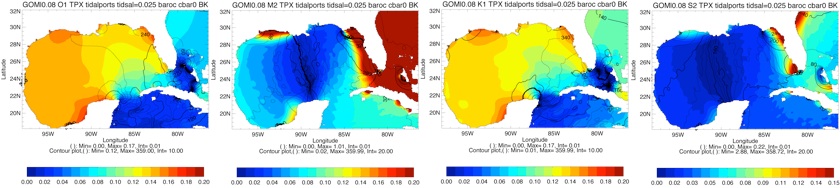
Here we used the GOMl0.08 in a baroclinic settings (starts from flat isopycnals with the mean stratification for August).
No nodal corrections, tidsal constant at 0.025.


FOR K1:


FOR M2:


FOR S2:
Tidal Drag, TIDSAL and NODAL corrections ........SENSITIVITY TESTS
(Not really physical but it was to check...
TIDSAL = 0.025 DRAGSCL=0.9 (cbar = 0.)


TIDSAL = 0.025 DRAGSCL=0.9 (cbar = 0.) + tangential tidal velocity

Latest simulations with the GOMl0.04
TIDSAL and TIDAL DRAG
Here we used the GOMl0.04 in barotropic and baroclinic (starts from flat isopycnals with the mean stratification for August) settings.
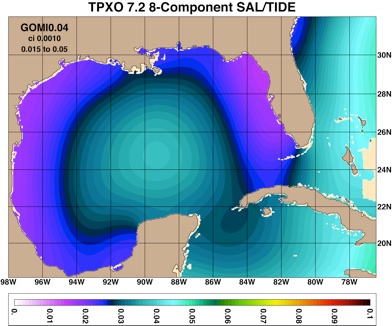
The self-attraction and Loading term (tidsal) is extracted from TPXO7.2 and varies with space as follow (Curtesy of A. Wallcraft):
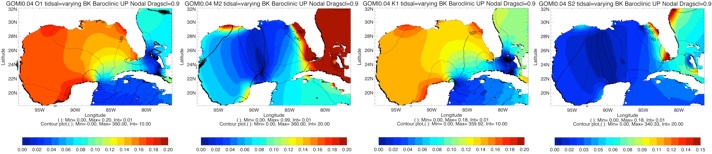
A parameterized topographic wave drag is also used (Arbic et al., 2010). A coefficient dragscl of 0.9 is used (as in the Global HYCOM configs) and the drag is applied over 500m from the bottom. No drag is applied if the water column is shallower than 500m.
The linear drag cbar is set to 0. and the quadratic bottom drag is set to 0.0022.
The open boundary conditions are based on Browning-Kreiss and nodal corrections are applied.


HYCOM-baroclinic
No NODAL TIDSAL = 0.025 DRAGSCL=0. (cbar = 0.) cb=0.0022


No NODAL TIDSAL = 0.025 DRAGSCL=0. (cbar = 0.) cb=0.0025


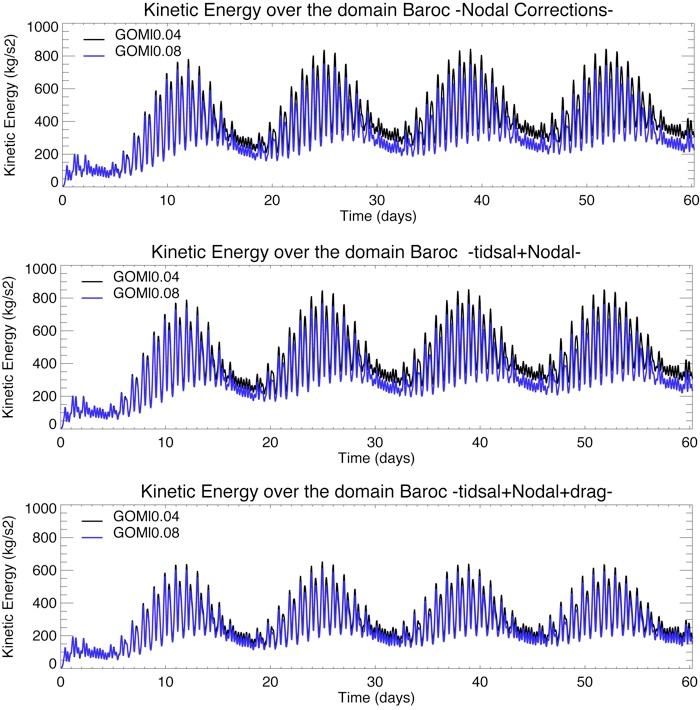
Impact of the drag on the Kinetic energy and Available potential energy
we compare the evolution of Kinetic energy when using only nodal corrections (Top), nodal corrections + tidsal (middle) and nodal corrections+tidsal+drag (bottom) for GOMl0.04 (black) and GOMl0.08 (blue).
We can see more energy in GOMl0.04 than GOMl0.08 when we use only nodal and nodal+tidsal but not so much difference between the 2 resolutions when we add the drag.
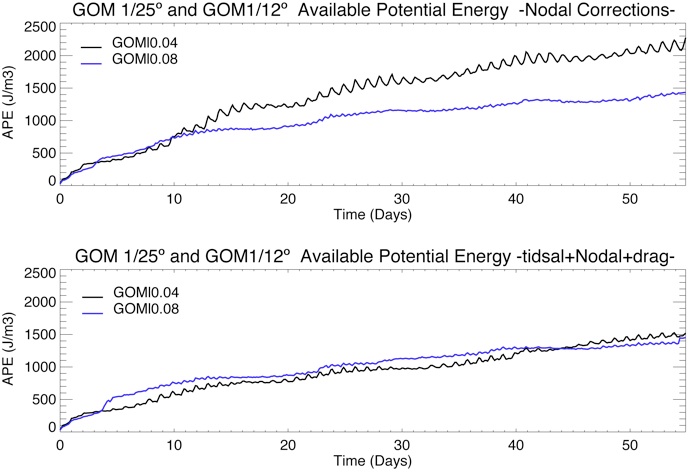
Same conclusions when we consider the APE with even more APE in the GOMl0.08 than in GOMl0.04 when the drag is used...
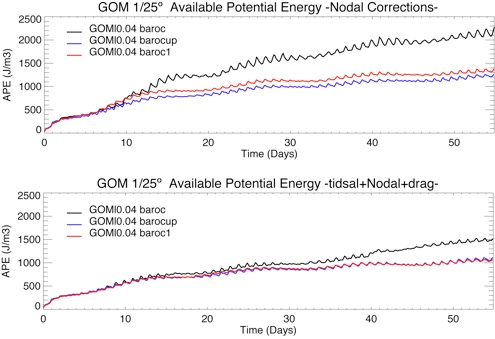
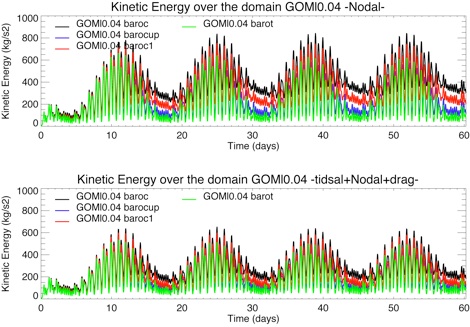
Kinetic Energy for GOMl0.04-Baroc (black), GOMl0.04-barocup (blue), GOMl0.04-baroc1 (red) and GOM0.04-barot (green) WITHOUT DRAG (top) and WITH DRAG (bottom).
Available Potential Energy for GOMl0.04-Baroc (black), GOMl0.04-barocup (blue) and GOMl0.04-baroc1 (red) WITHOUT DRAG (top) and WITH DRAG (bottom).
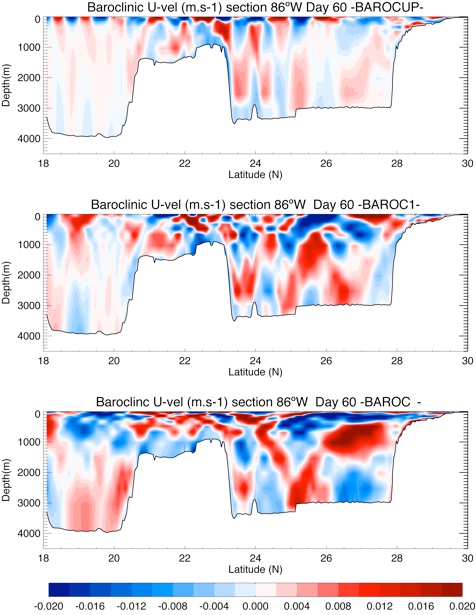
Zonal baroclinic velocity at 86ºW for GOMl0.04-Baroc (bottom), GOMl0.04-barocup (top) and GOMl0.04-baroc1 (middle).
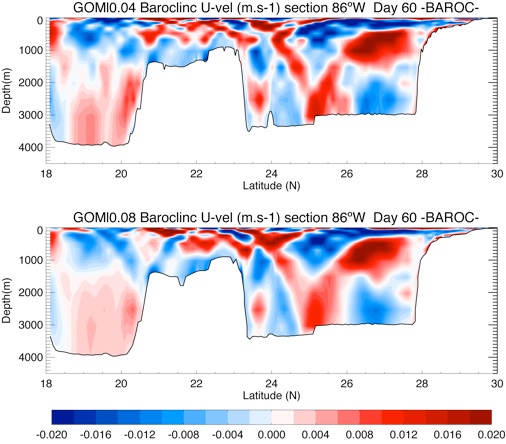
Zonal baroclinic velocity at 86ºW for GOMl0.04-Baroc (top), and GOMl0.08-baroc (bottom).
Time Series of Energy Fluxes integrated over the Gulf of Mexico only ( 1/H *sum(u’p’dz)*area in GW) for GOMl0.04-Baroc (black), GOMl0.04-barocup (blue) and GOMl0.04-baroc1 (red) and comparison with GOMl0.08.


Comparison of amplitudes and phases of M2 and O1 vs. tidal gauges for GOMl0.04 barotropic
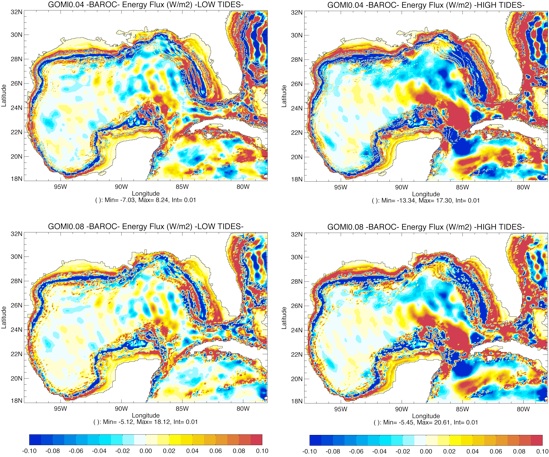
Map of Energy Fluxes ( 1/H *sum(u’p’dz) in W/m2) for GOMl0.04-Barocup (top), GOMl0.04-baroc1 (middle) and GOMl0.04-baroc (bottom) during Low Tides (day 59) and High Tides (day 52).
Map of Energy Fluxes for GOMl0.04-Baroc (top), GOMl0.08-baroc (bottom) during Low Tides (day 59) and High Tides (day 52).

IMPACT OF TIDES IN A REALISTIC CONFIGURATION
Experimental Set-up :
Initial condition from 1st of August 2008 (expt_20.1 GOMl0.04 assimilated HYCOM website)
Atmospheric forcing from NOGAPS
Two experiments with GOMl0.04 : With and Without TIdes
Two experiments with GOMl0.08 : With and Without TIdes
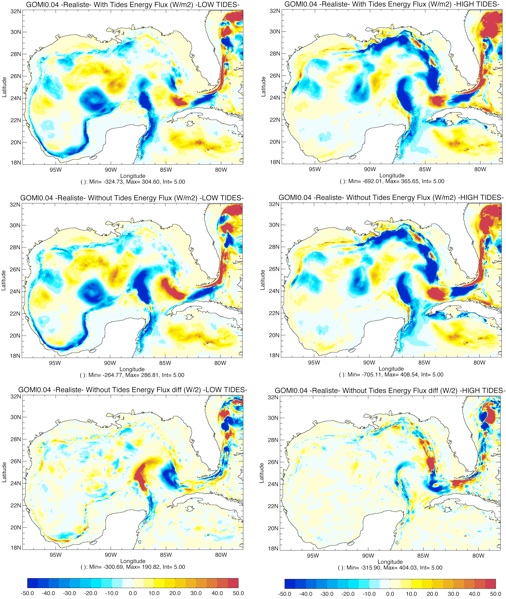
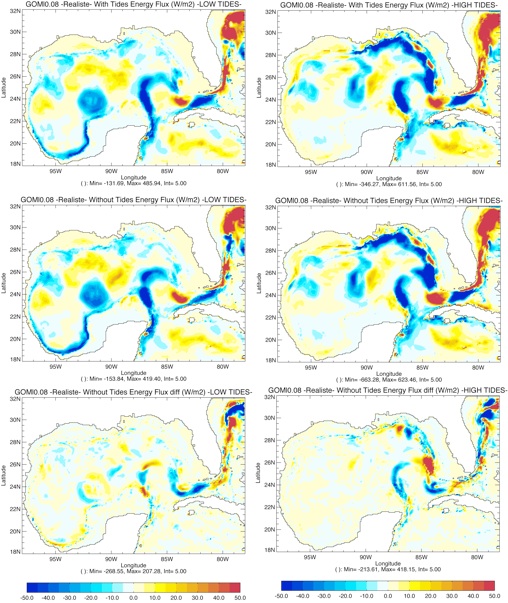
Map of Energy Fluxes ( 1/H *sum(u’p’dz) in W/m2) for GOMl0.04-realiste with tides (top), GOMl0.04-realiste without (middle) and the difference (bottom) during Low Tides (day 59) and High Tides (day 30).
Map of Energy Fluxes ( 1/H *sum(u’p’dz) in W/m2) for GOMl0.08-realiste with tides (top), GOMl0.08-realiste without (middle) and the difference (bottom) during Low Tides (day 59) and High Tides (day 30).

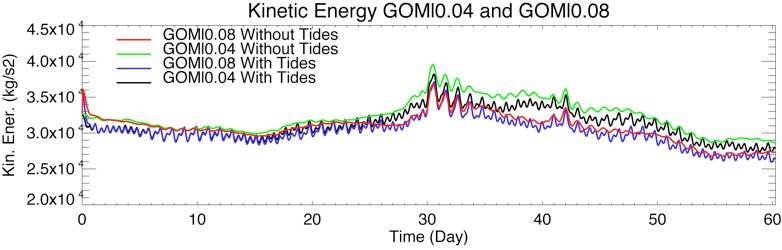
Time Series of Energy Fluxes integrated over the Gulf of Mexico only ( 1/H *sum(u’p’dz)*area in TW) for GOMl0.04-realiste with tides (black), GOMl0.08-realiste with tides (blue), GOMl0.04-realiste without tides (green) and GOMl0.08-realiste without tides (red). Since there is no “state of rest” in a realistic configuration, the reference state is the initial condition.

Hurricane Gustave

Hurricane Ike
Hurricane Gustave

Hurricane Ike

HYCOM-realistic

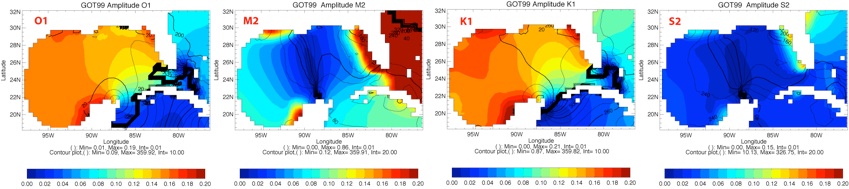
Comparison of amplitudes and phases of M2 and O1 in the barotropic GOMl0.04 and the GOT99. Purples triangles show the location of the tidal gauges used for the validation.