Gulf Stream Configuration
STRc0.04:
Domain : [82ºW, 35ºW, 28ºN, 47ºN] (i,j,k: 1175,605,30)
Fig 1: Bathymetry extracted from Global 1/25º.

Experimental Setup :
Expt_10.2: relaxation on 10 points at the boundaries: 0.05, 0.5, 1, 1, 1 ...day
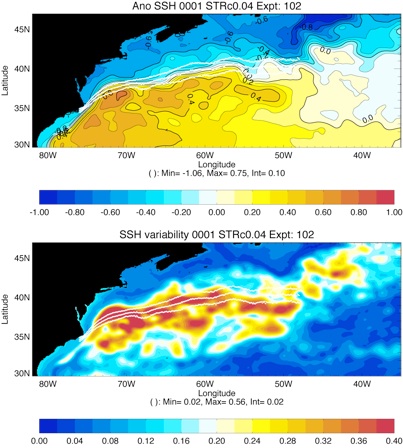
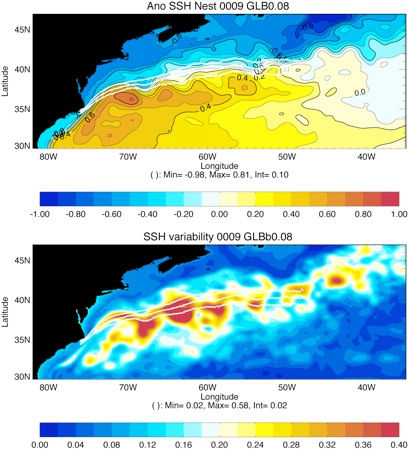
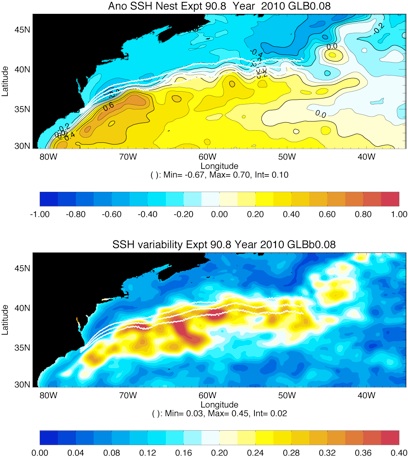
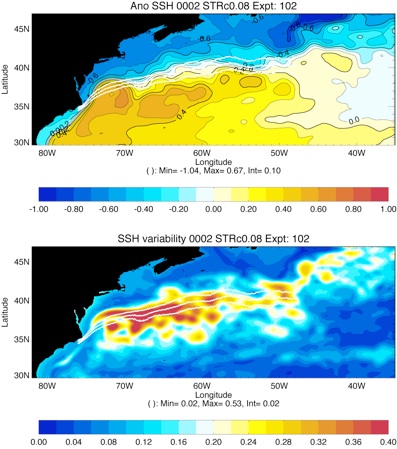
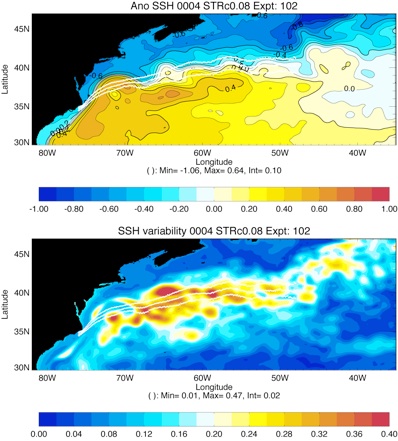
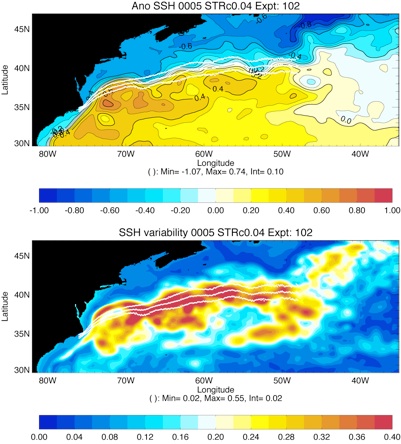
Fig 2: Mean SSH and SSH variability for the 5 year of simulation for Expt 10.1 and Expt 10.2. To compare with Year 8 of GLBa0.08 Expt 18.0 and assimilated run GLBa0.08 Expt 90.8 .
YEAR 0008
YEAR 0009


YEAR 1
STRc0.08
STRc0.04


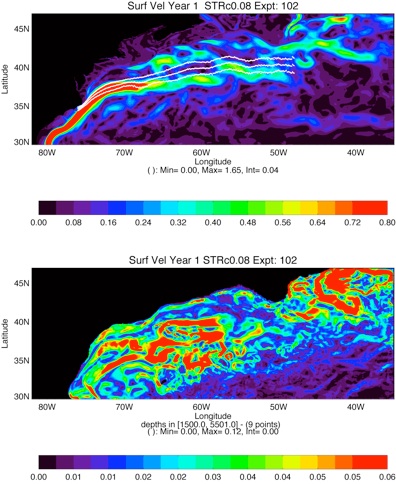
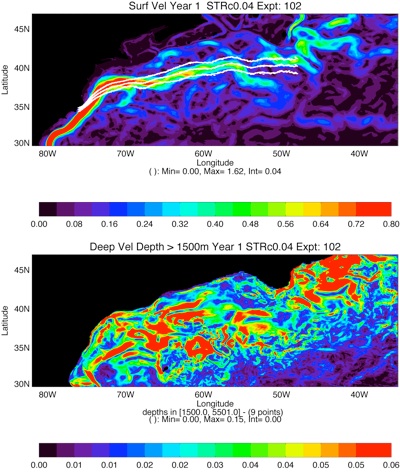
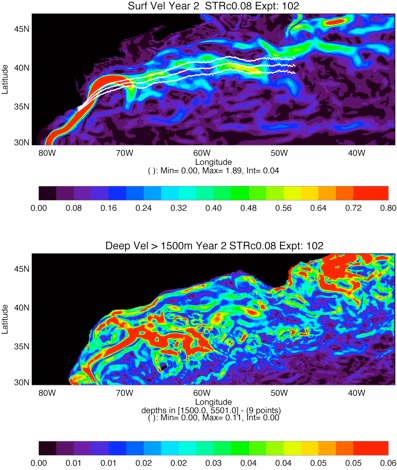
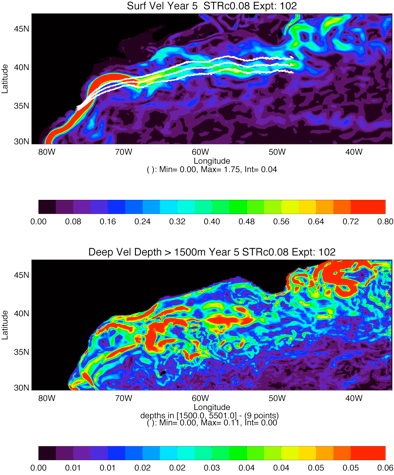
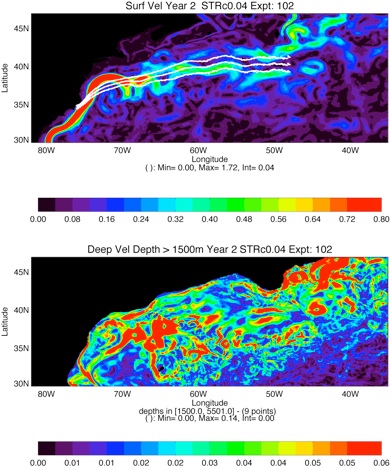
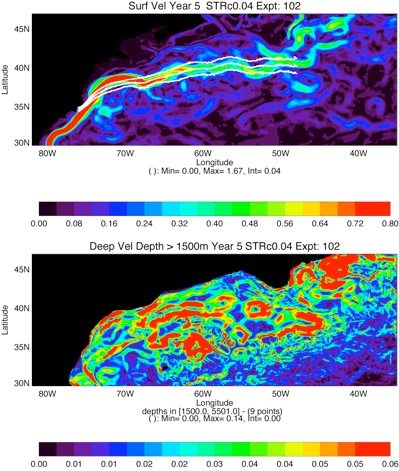
Fig 3: Surface speed (top panel) and Mean speed under 1500m (bottom panel) for Expt 18.0 (Year 8), and Expt 10.2 STRc0.08 and 10.2 STRc0.04
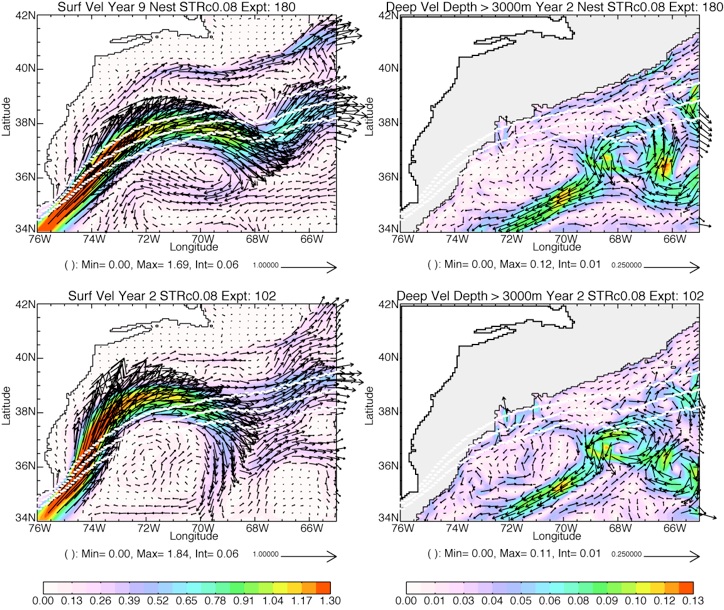
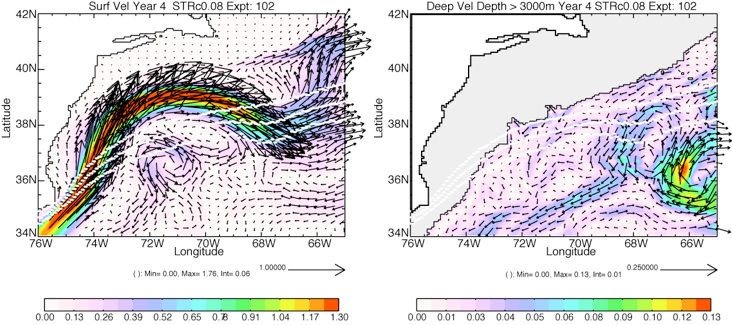
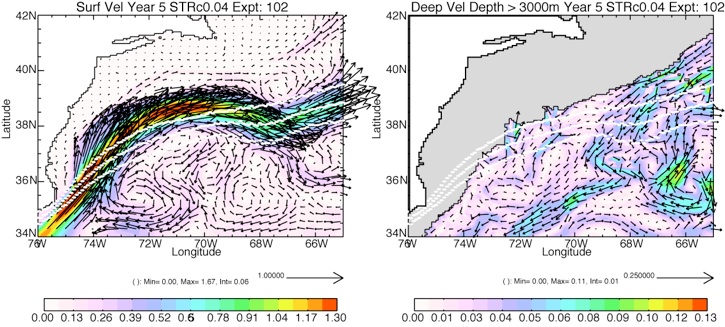
Fig 4: zoom of the Cape Hatteras region; left, surface speed at 25m, right, mean velocity below 3000m for GLBa0.08 expt 18.0 (top), STRc0.08 expt 10.2 (middle) and STRc0.04 expt_10.2 (bottom). YEAR 1.
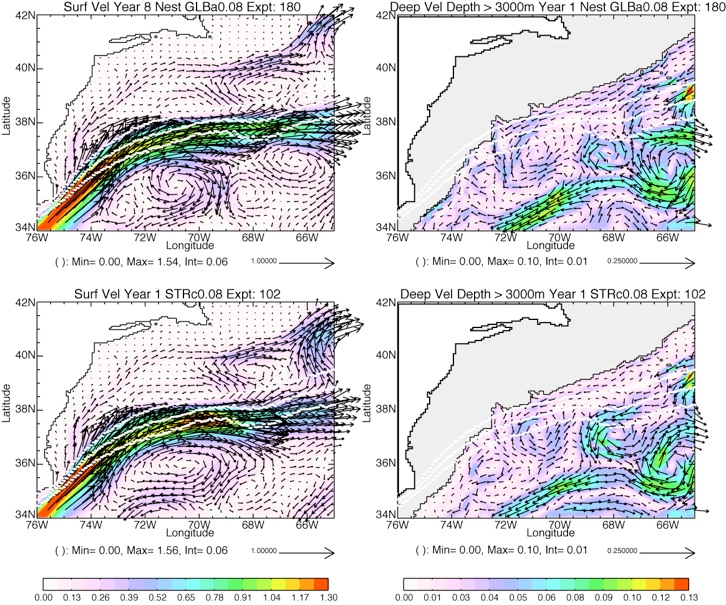
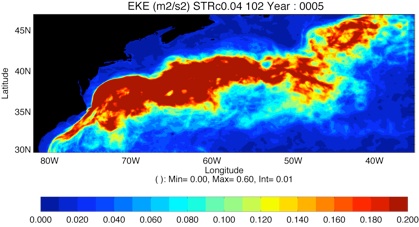
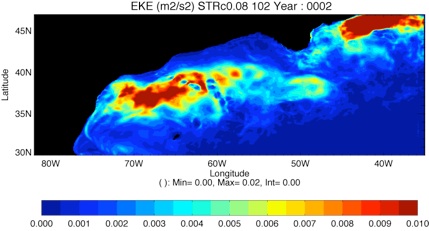
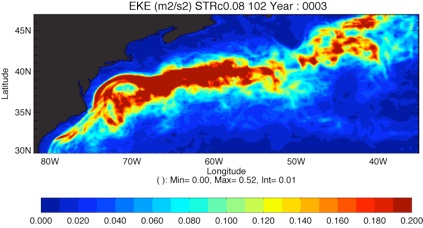
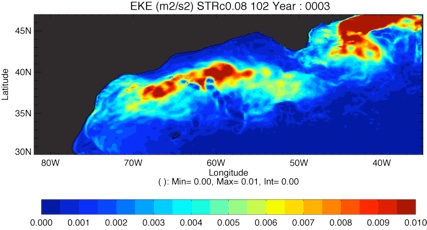
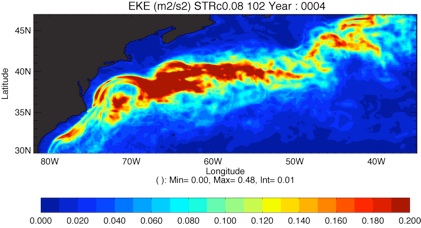
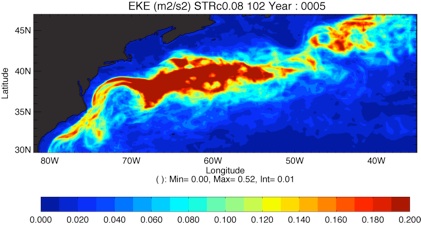
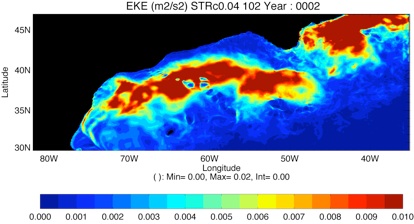
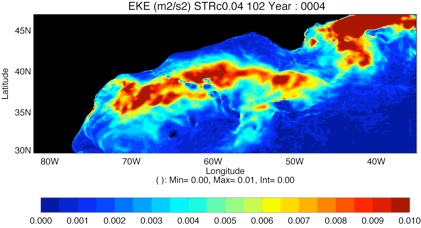
Fig 8: Surface EKE for Expt 18.0 (Year 8 & Year 9), STRc0.08 Expt 10.1 and Expt 10.2
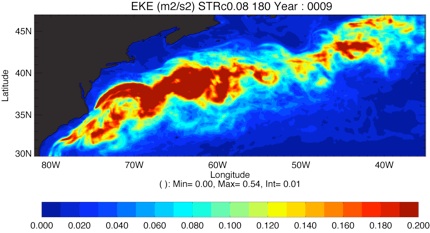
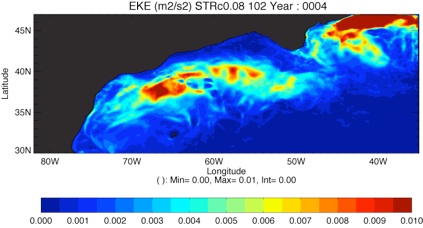
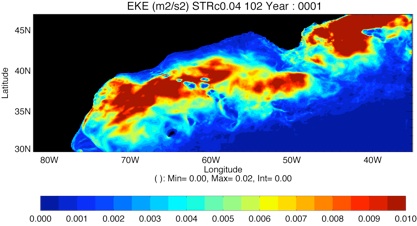
Fig 9: Bottom EKE (integrated from 1500m to bottom) for Expt 18.0 (Year 8 & Year 9), STRc0.08 Expt 10.1 and Expt 10.2


STRc0.08
GLBa0.08
GLBa0.08
GLBa0.08
YEAR 2
STRc0.04
YEAR 2
YEAR 1
STRc0.08
STRc0.08
Fig 5: zoom of the Cape Hatteras region; left, surface speed at 25m, right, mean velocity below 3000m for GLBa0.08 expt 18.0 (top), STRc0.08 expt 10.2 (middle) and STRc0.04 expt_10.2 (bottom). YEAR 2.

STRc0.08
GLBa0.08
YEAR 1

YEAR 2

STRc0.08
YEAR 1
GLBa0.08
YEAR 2

YEAR 3

YEAR 3
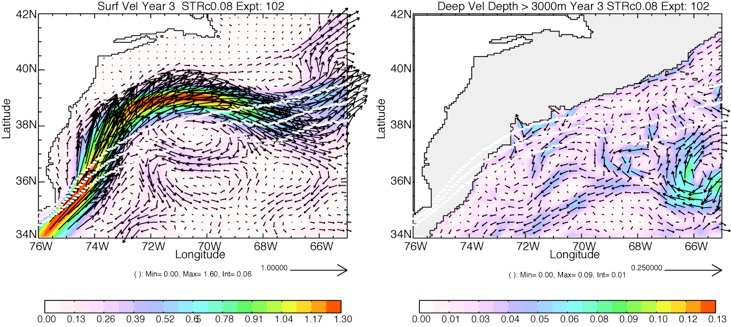
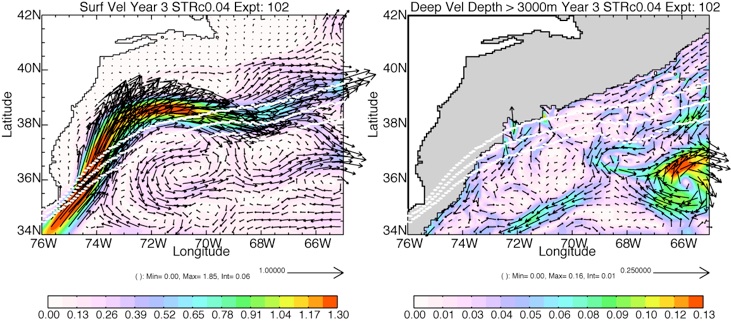
Fig 6: zoom of the Cape Hatteras region; left, surface speed at 25m, right, mean velocity below 3000m STRc0.08 expt 10.2 (top) and STRc0.04 expt_10.2 (bottom). YEAR 3.
STRc0.08
YEAR 3
YEAR 3
YEAR 4

YEAR 4
STRc0.08
Fig 7: zoom of the Cape Hatteras region; left, surface speed at 25m, right, mean velocity below 3000m STRc0.08 expt 10.2 (top) and STRc0.04 expt_10.2 (bottom). YEAR 4.
YEAR 4
YEAR 4

YEAR 5

STRc0.08
YEAR 5


YEAR 1
STRc0.04

STRc0.04
STRc0.04


YEAR 2
STRc0.04
YEAR 3
STRc0.04


YEAR 4
STRc0.04


STRc0.04
YEAR 5