

Gulf Stream Configuration
STRc0.08:
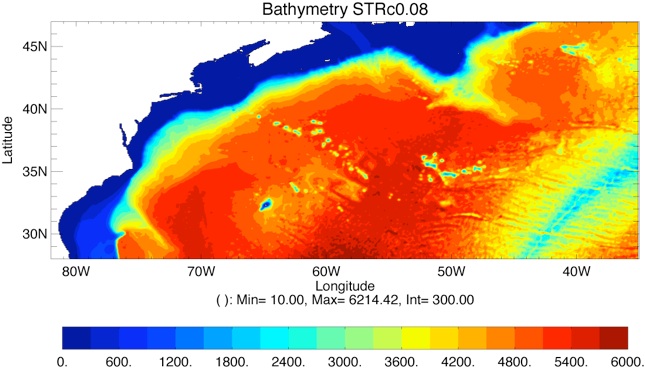
Domain : [82ºW, 35ºW, 28ºN, 47ºN] (i,j,k: 588,303,30)
Fig 1: Bathymetry extracted from Global 1/12º.
-
✓ Comparison with Observations (Schott et al. 2004) with the best year of each experiment:
(Schott, F.A., Zantopp, R., Stramma, L., Dengler, M., Fischer, J., Wibaux, M., 2004, Circulation and Deep-Water Export at the Western Exit of the Subpolar North Atlantic, Journal of Physical Oceanography, 34, pp 817-843.)
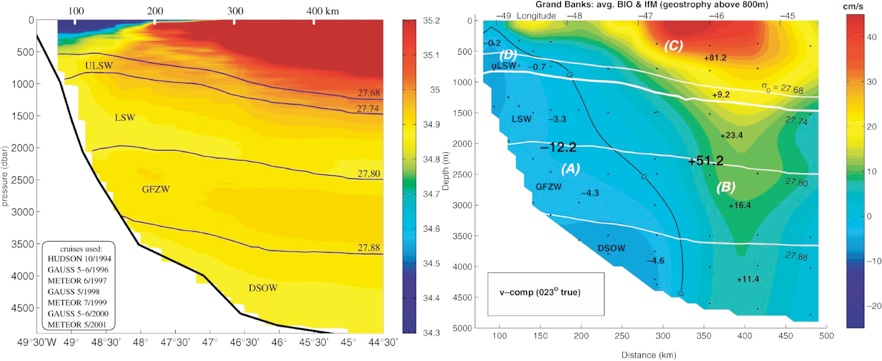
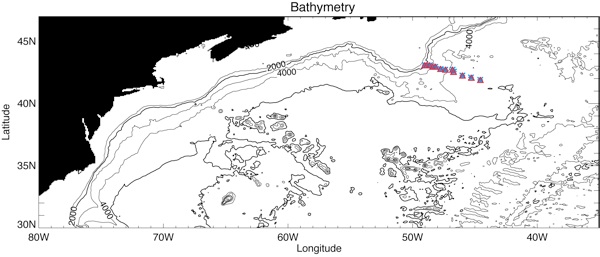
Locations of the mooring in blue;
co-location on the HYCOM grid in red.
-
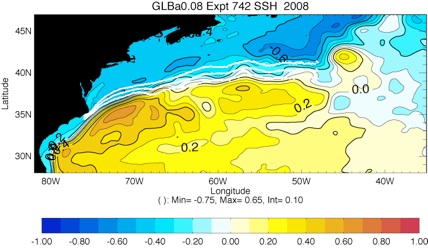
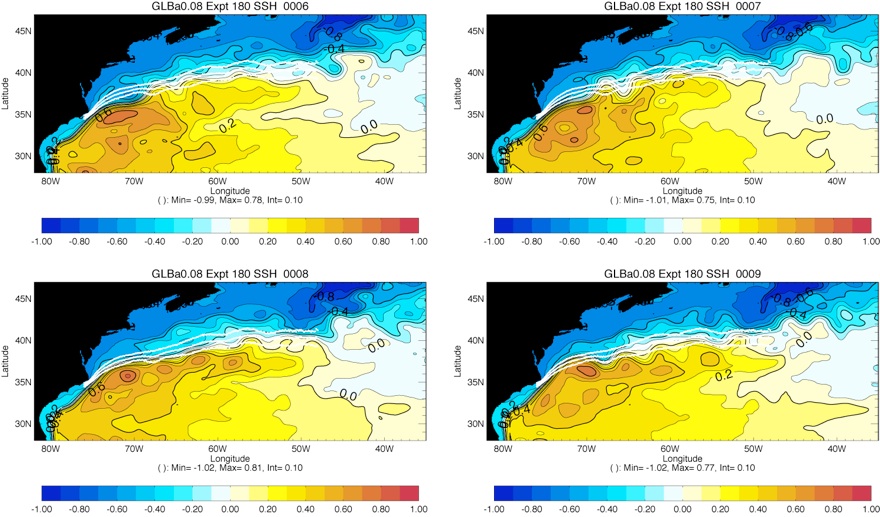
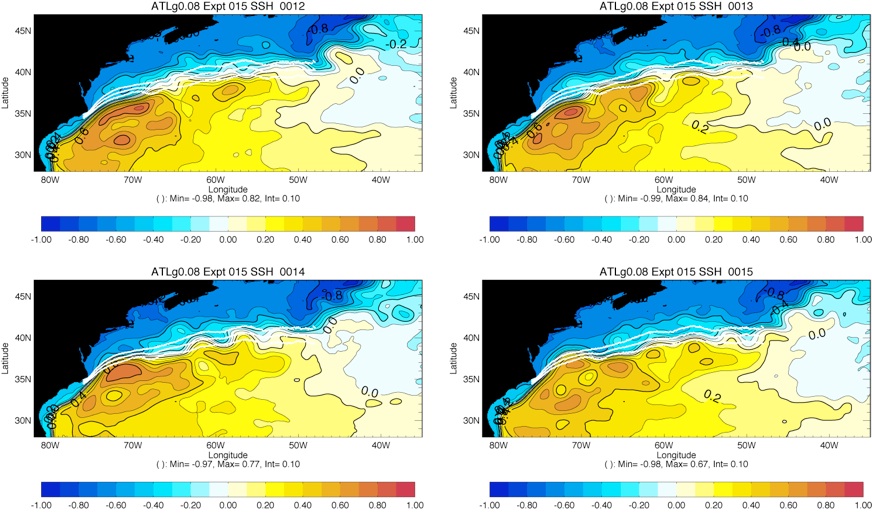
✓ Comparison of SSH from potential Boundary conditions:
Fig 2: SSH from GLBa0.08 expt 74.2 used in STRb0.08
Fig 3: SSH from GLBa0.08 expt 18.0 from Year 6 to Year 9
Fig 4: SSH from ATLg0.08 expt 01.5 from Year 12 to Year 15
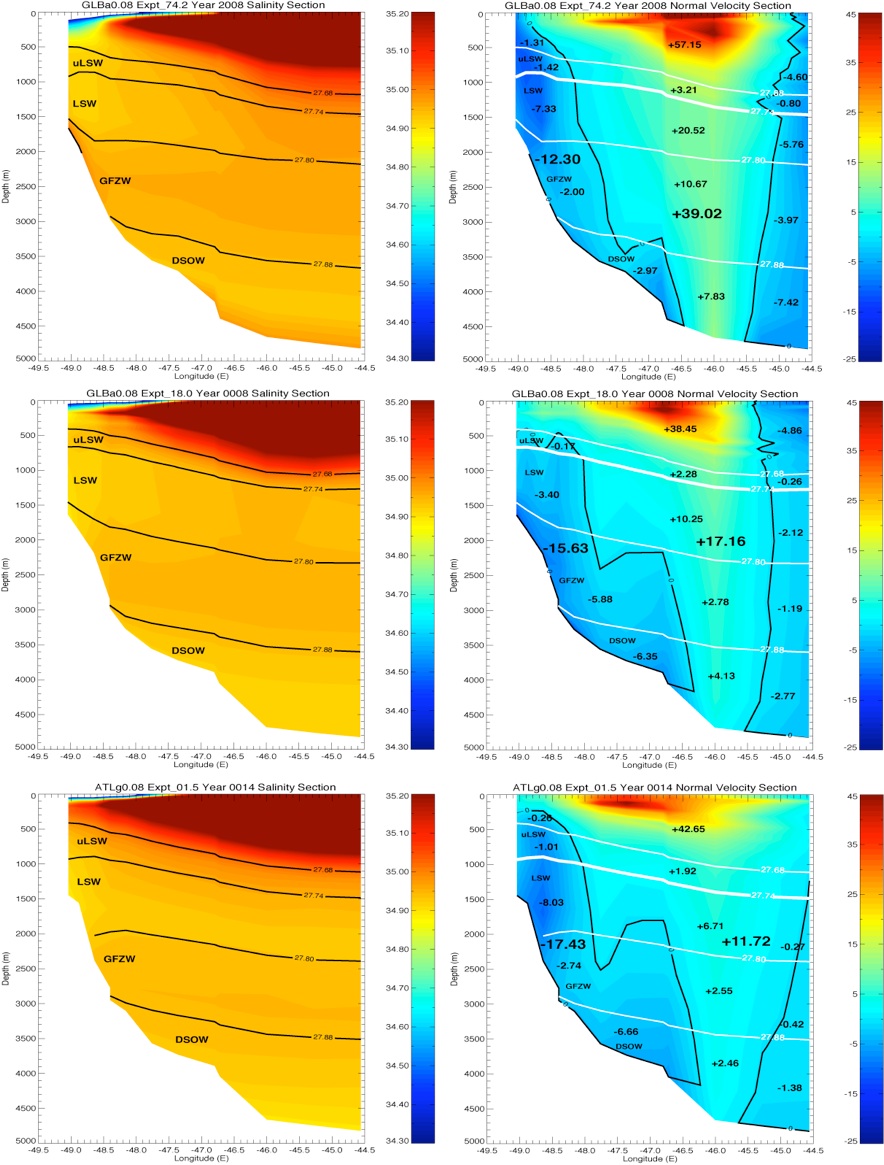
Fig 5: Salinity and Velocity section for each experiment
Experimental Setup :
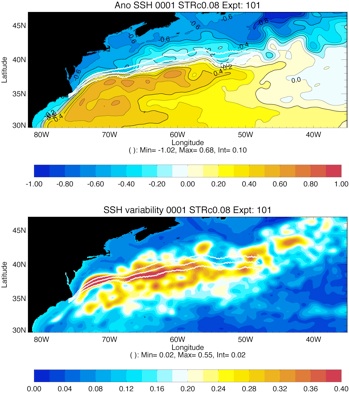
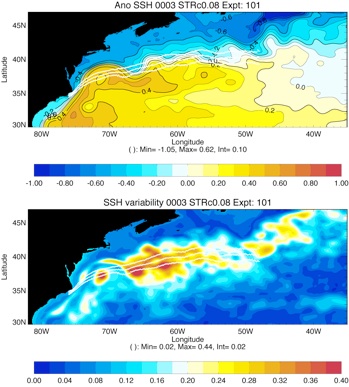
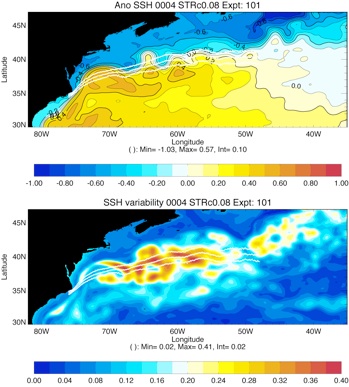
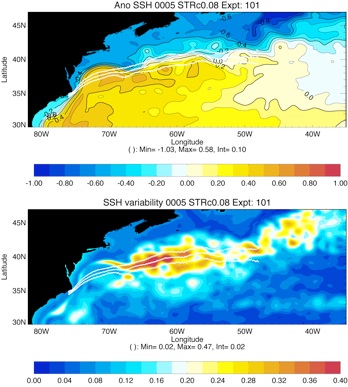
Expt_10.1 : relaxation on 10 points at the boundaries from 1 day to 10 days
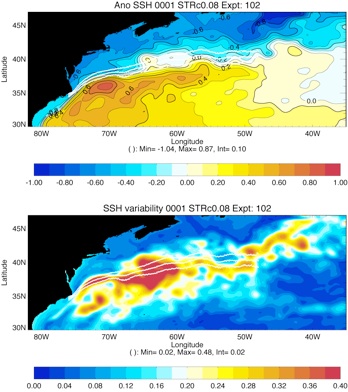
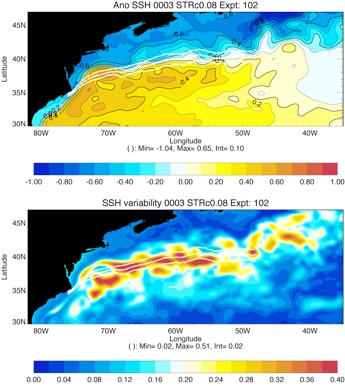
Expt_10.2: relaxation on 10 points at the boundaries: 0.05, 0.5, 1, 1, 1 ...day
Expt_10.3: as expt_10.2 with cbar=0.002m/s

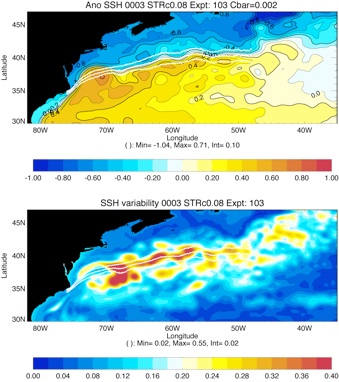
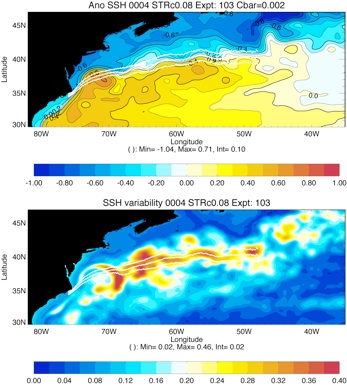
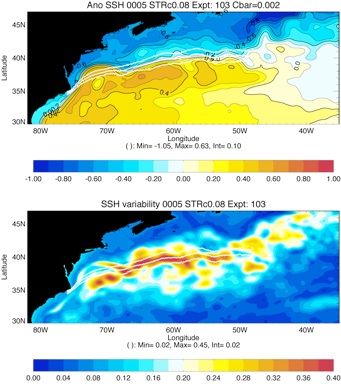
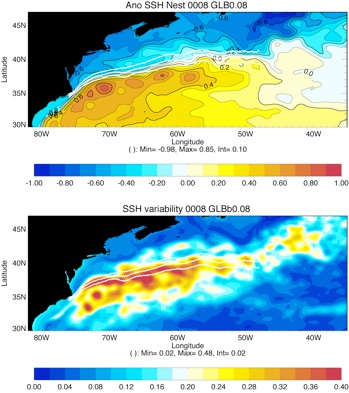
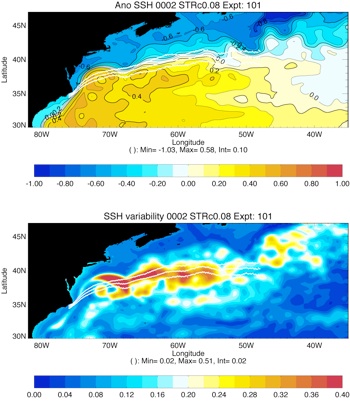
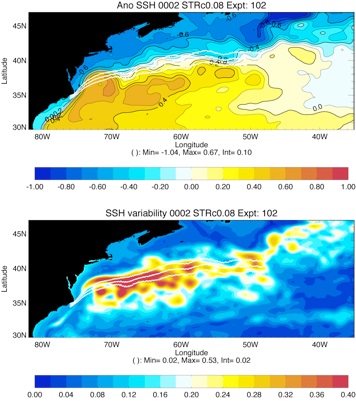
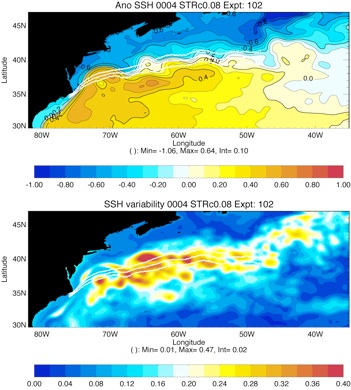
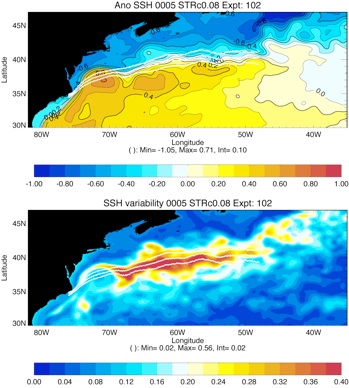
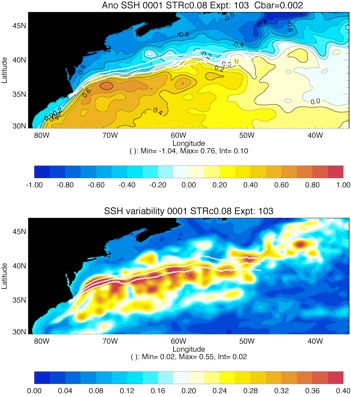
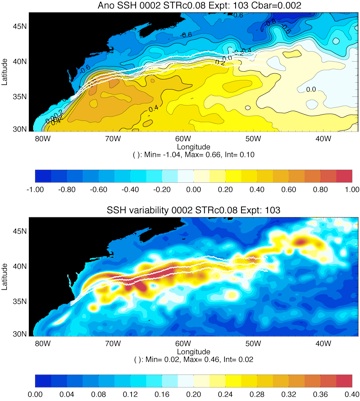
Fig 8: Mean SSH and SSH variability for the 5 year of simulation for Expt 10.1 and Expt 10.2. To compare with Year 8 of GLBa0.08 Expt 18.0 and assimilated run GLBa0.08 Expt 90.8 .
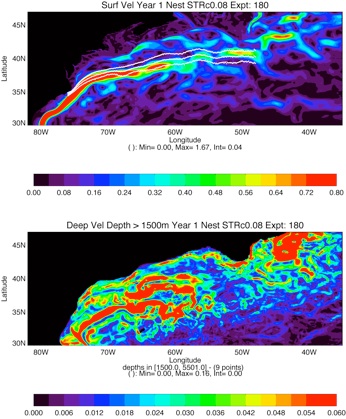
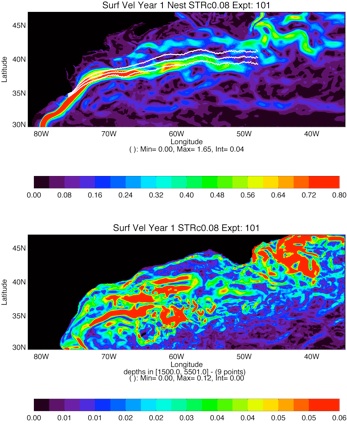

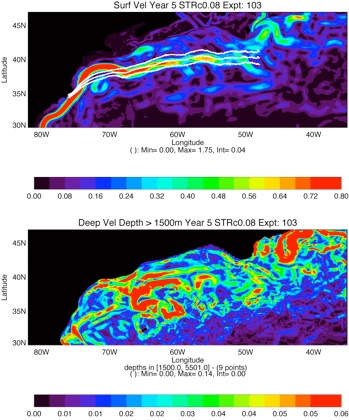
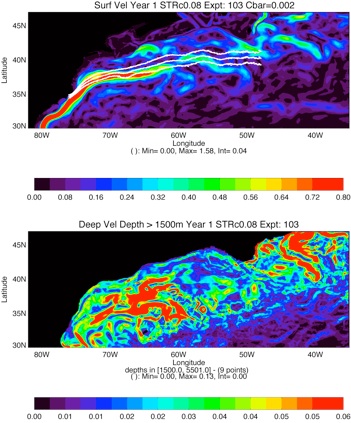
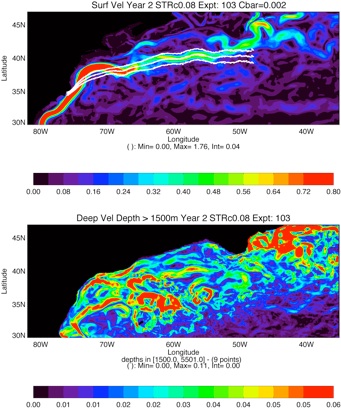
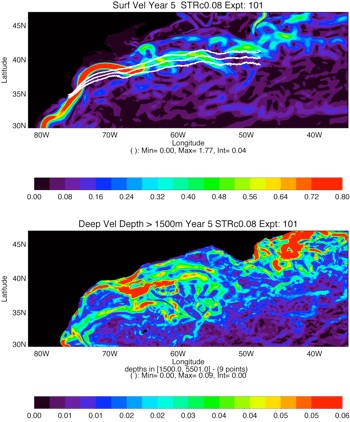
Fig 9: Surface speed (top panel) and Mean speed under 1500m (bottom panel) for Expt 18.0 (Year 8), Expt 10.1 and Expt 10.2
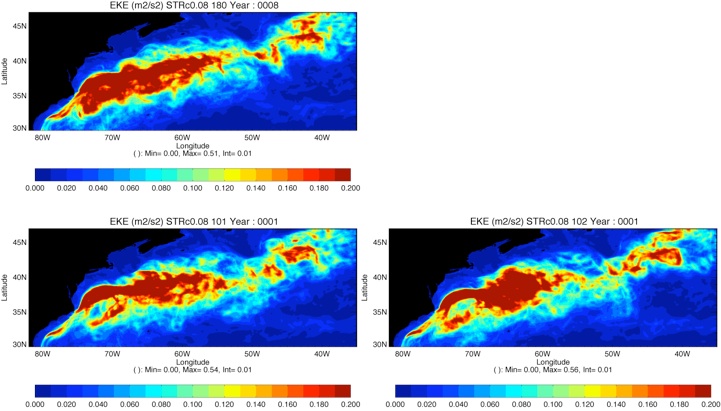
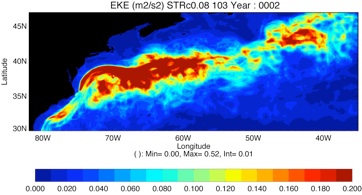
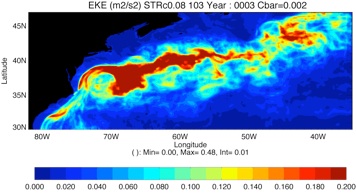
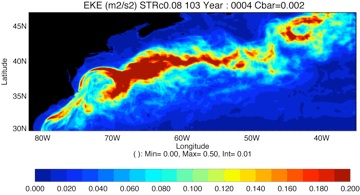
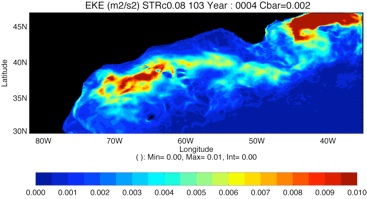
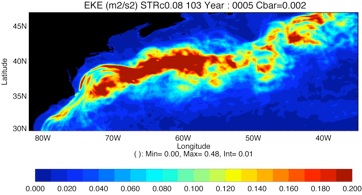
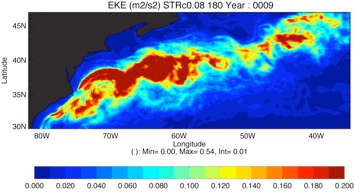
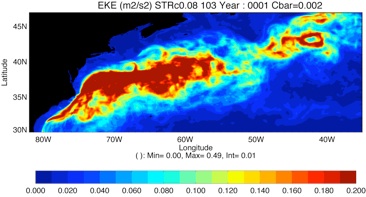
Fig 13: Surface EKE for Expt 18.0 (Year 8 & Year 9), Expt 10.1 and Expt 10.2
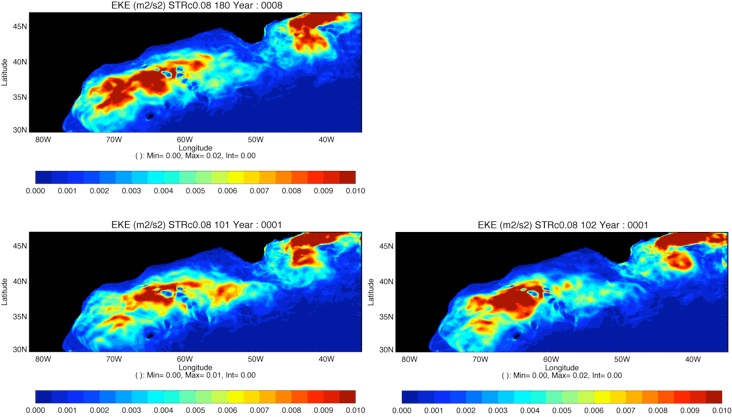
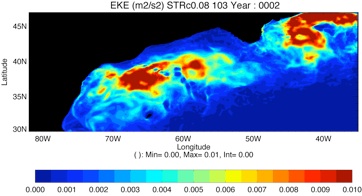
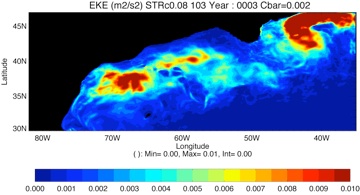
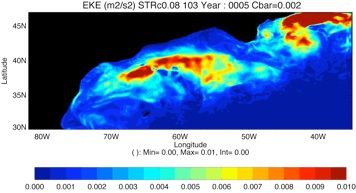
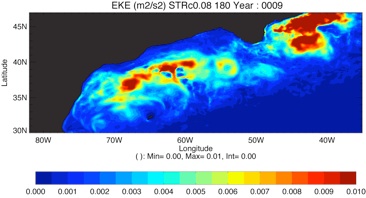
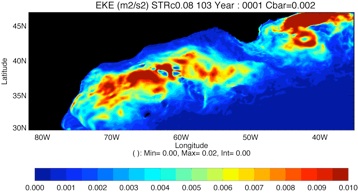
Fig 14: Bottom EKE (integrated from 1500m to bottom) for Expt 18.0 (Year 8 & Year 9), Expt 10.1 and Expt 10.2
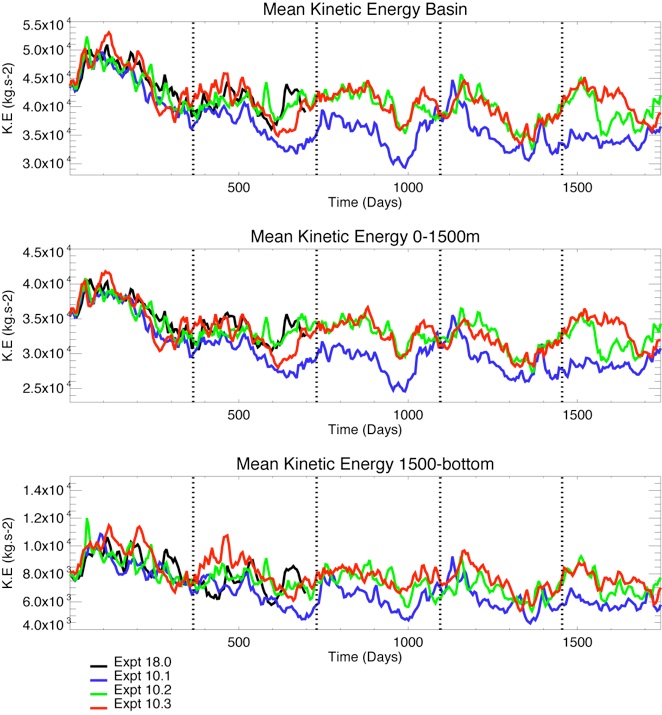
Fig 15: Time series of Mean Kinetic Energy for Expt 18.0 (black), Expt 10.1 (blue), Expt 10.2 (green) and Expt 10.3 (red)
YEAR 1
YEAR 2
YEAR 1
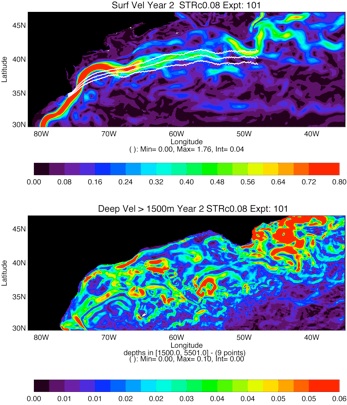
YEAR 2
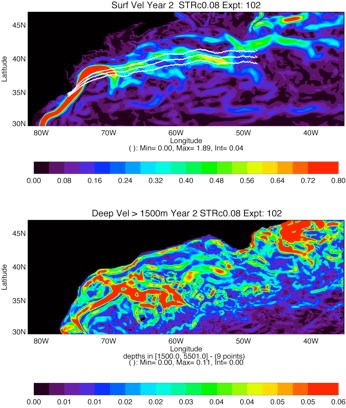


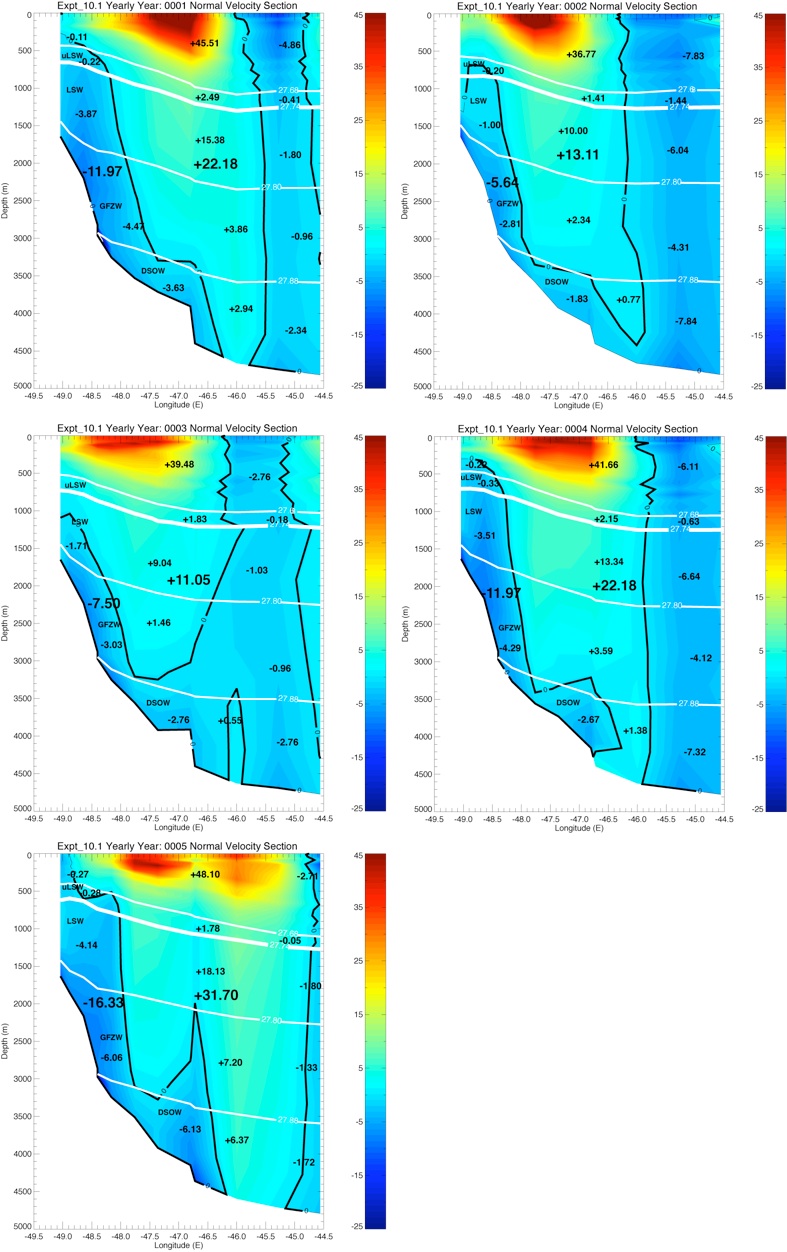
Fig 6: Schott Section for Expt 10.1 for year 1 to 5
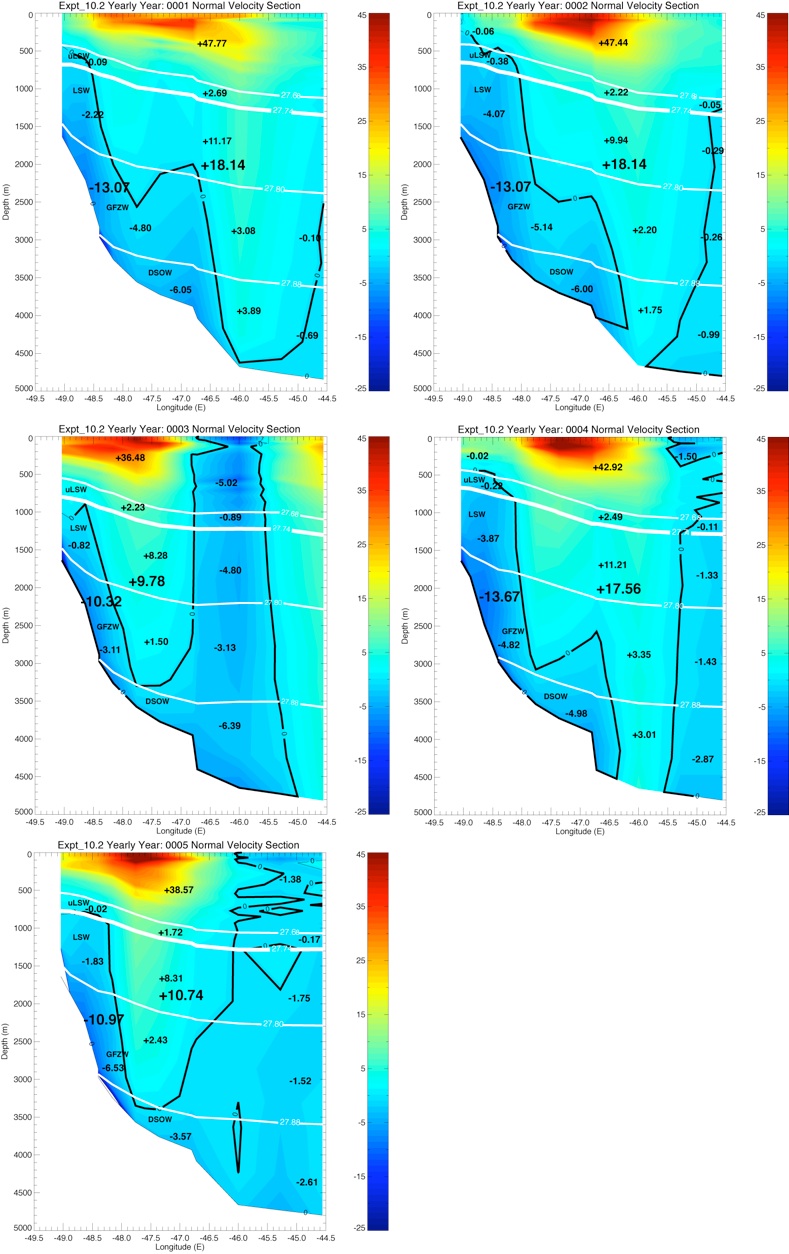
Fig 7: Schott Section for Expt 10.2 for year 1 to 5
YEAR 3
YEAR 4
YEAR 5



GLBa0.08 Year 8 & 9
YEAR 1
YEAR 2
YEAR 3
YEAR 4
YEAR 5

GLBa0.08 Year 8 & 9
YEAR 1
YEAR 2
YEAR 4
YEAR 5

YEAR 3
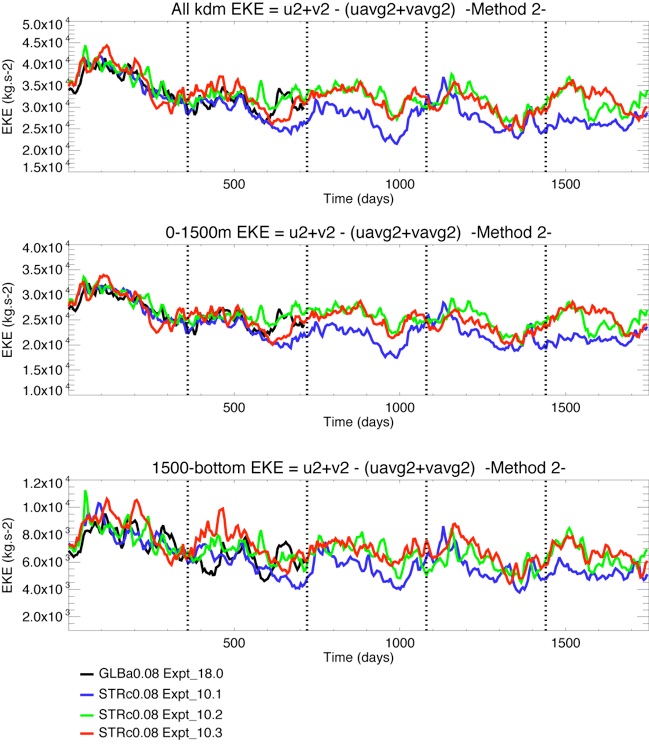
Fig 16: Time series of Eddy Kinetic Energy (top) over the whole water column, (middle) 0-1500m and (bottom) 1500m-bottom for Expt 18.0 (black line), Expt 10.1 (blue line), Expt 10.2 (green line) and Expt 10.3 (red), following method 2: EKE = 0.5* rho * ( u2 + v2 ) - 0.5 * rho * ( uavg2 + vavg2)
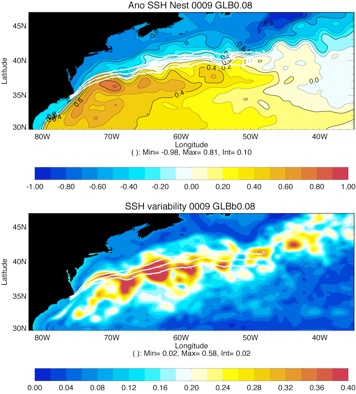

YEAR 0008
YEAR 0009
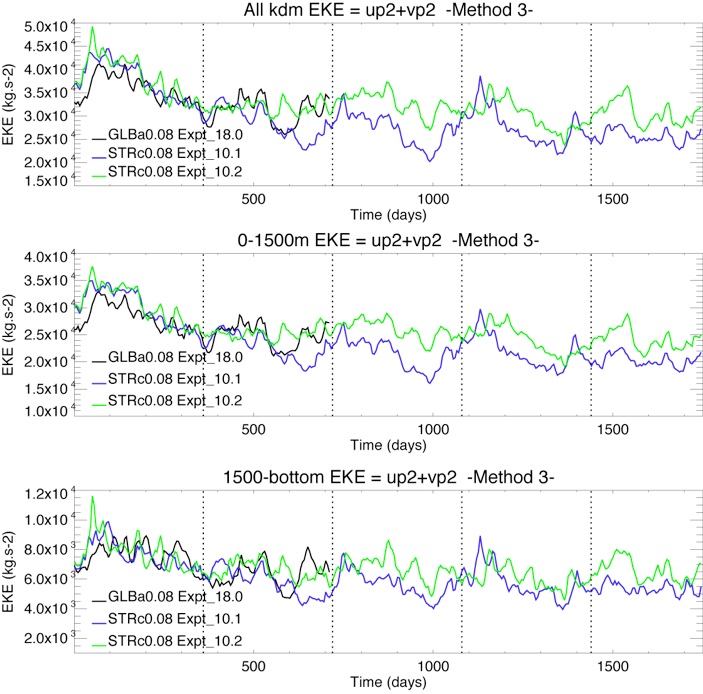
Fig 17: Time series of Eddy Kinetic Energy (top) over the whole water column, (middle) 0-1500m and (bottom) 1500m-bottom for Expt 18.0 (black line), Expt 10.1 (blue line) and Expt 10.2 (green line), following method 3: EKE = 0.5* rho * ( u’2 + v’2 )
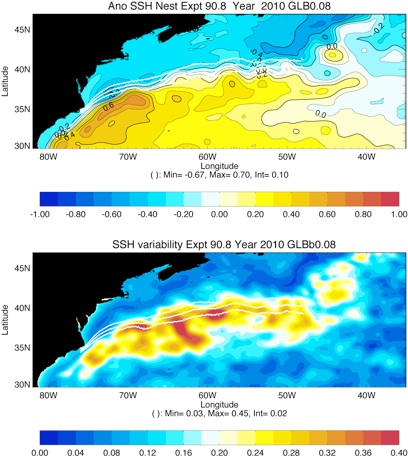
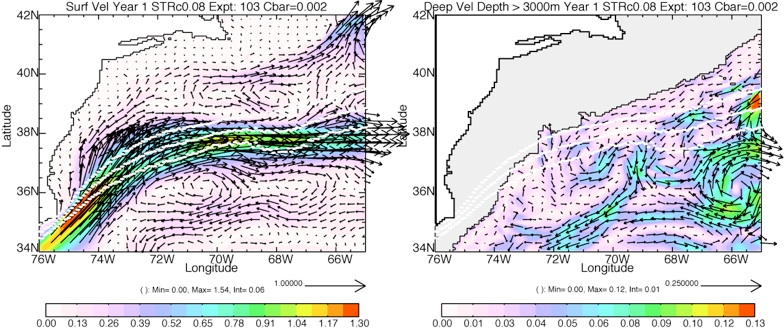
Fig 10: zoom of the Cape Hatteras region; left, surface speed at 25m, right, mean velocity below 3000m for GLBa0.08 expt 18.0 (top), STRc0.08 expt 10.1 (middle) and expt_10.2 and expt_10.3 (bottom). YEAR 1.
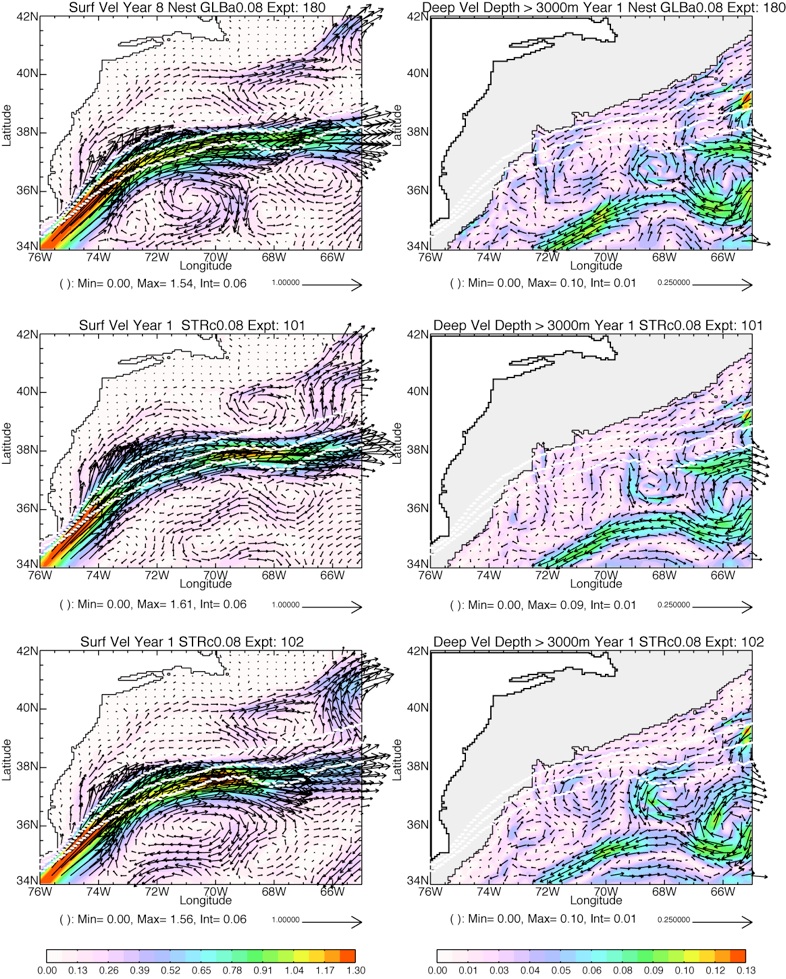
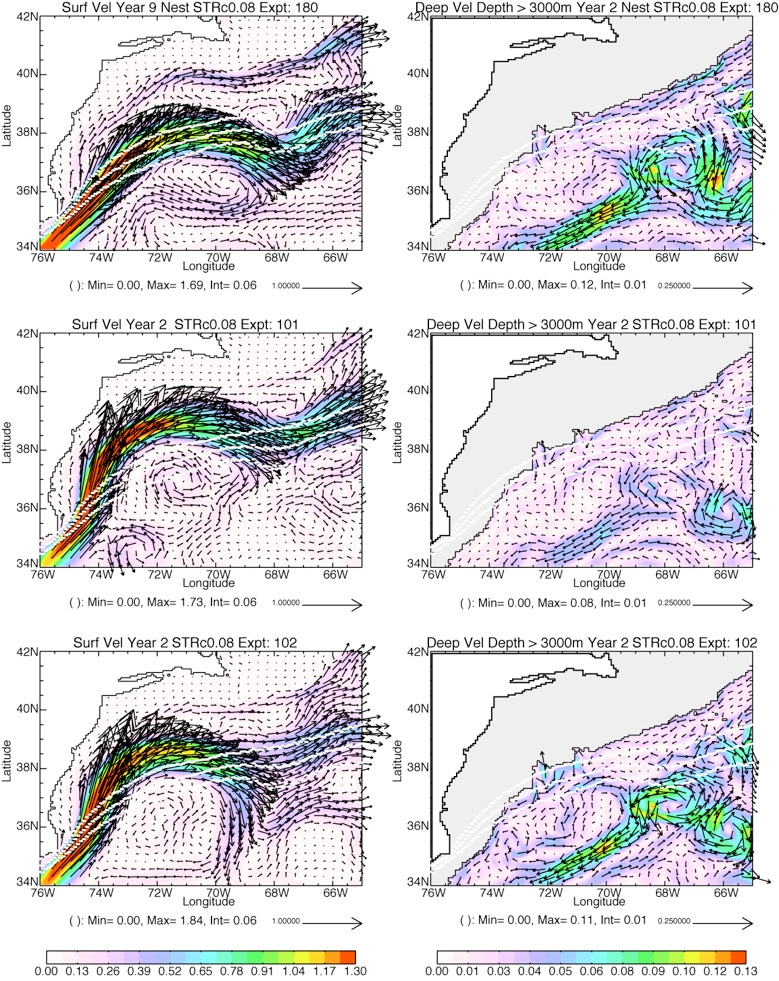
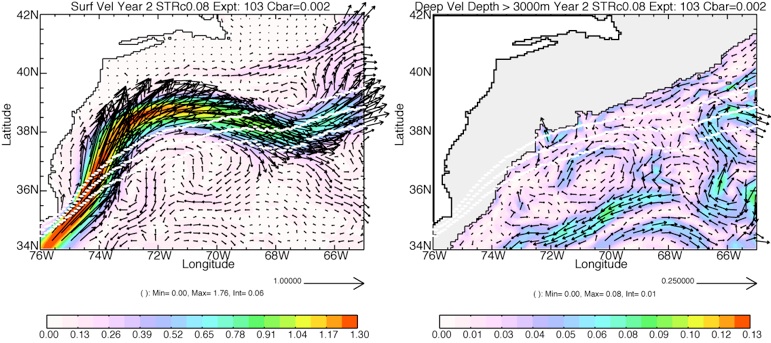
Fig 11: zoom of the Cape Hatteras region; left, surface speed at 25m, right, mean velocity below 3000m for GLBa0.08 expt 18.0 (top), STRc0.08 expt 10.1 (middle) and expt_10.2, expt_10.3 (bottom). YEAR 2.
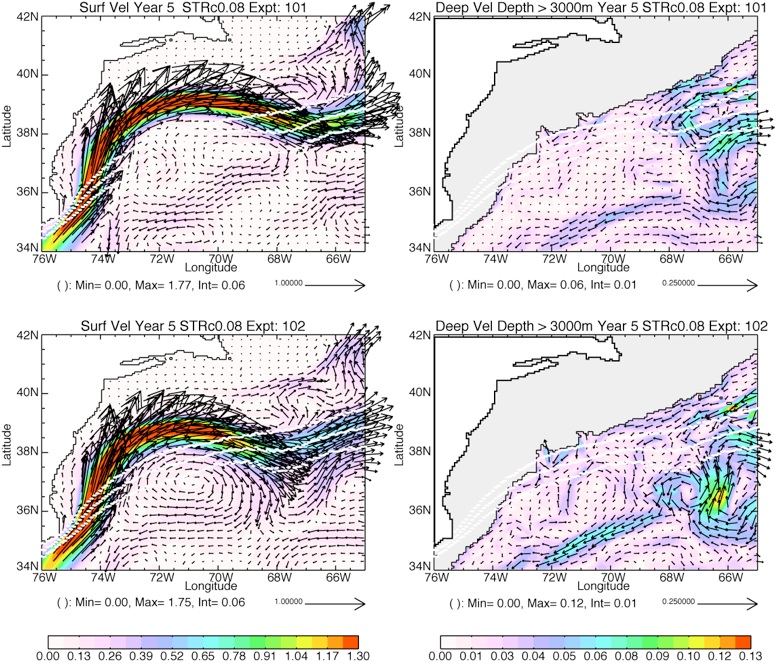
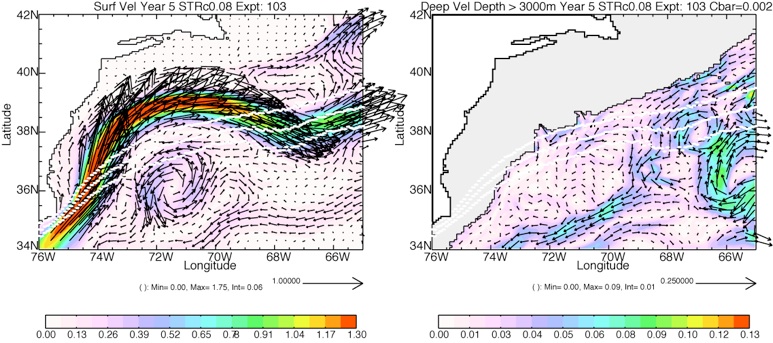
Fig 12: zoom of the Cape Hatteras region; left, surface speed at 25m, right, mean velocity below 3000m for STRc0.08 expt 10.1 (top) and expt_10.2 and expt_10.3 (bottom). YEAR 5.

YEAR 5
