
SODA Reanalysis:70-80N
Center for Ocean Atmospheric Prediction Studies
Florida State University
200 R.M. Johnson Bldg, Tallahassee, FL, 32306-2840

I consider the domain from -80E to 30E and from 70N to 80N (green box):

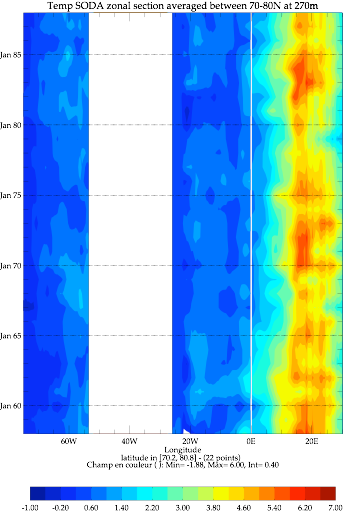
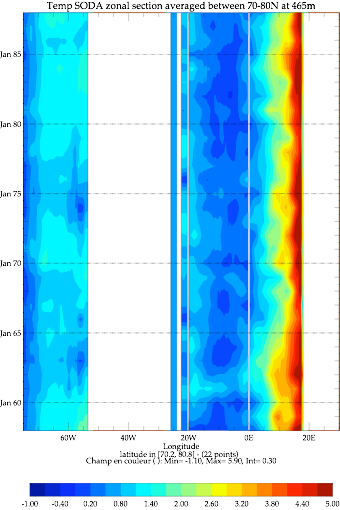
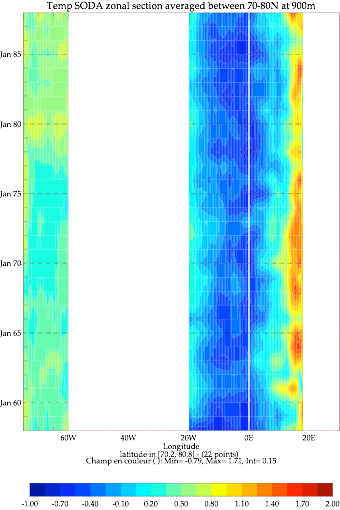
HOVMOLLER DIAGRAM: 1958 to 1988 on section -80E to 30E
Temperature and Salinity averaged over the first 1000m in the green box
Data Access: http://www.atmos.umd.edu/~ocean/data.html
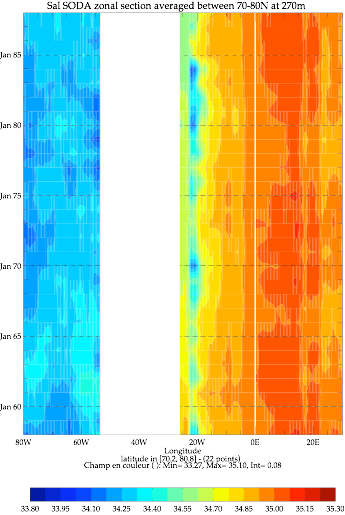
SALINITY
TEMPERATURE
-270m-
SALINITY
TEMPERATURE
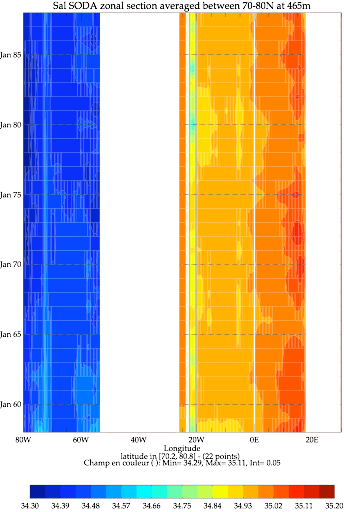
-465m-
SALINITY
TEMPERATURE
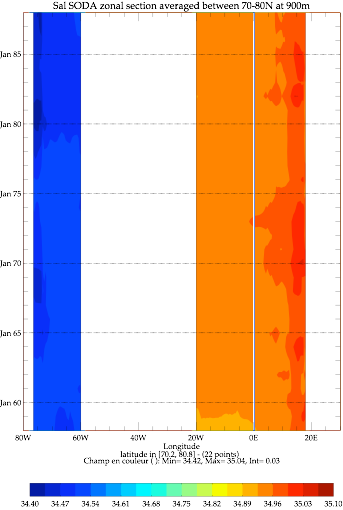
-900m-
