Temporally Weighted Winds
Frames from the COAPS/NSCAT movies are shown here. Each image shows either an interesting event or the large scale circulation pattern. The wind patterns are shown by vectors, with arrow lengths proportional to the wind speed. The vectors are red in areas of convergence, and blue in areas of divergences. The background color shows relative vorticity. In the northern hemisphere, high pressure systems (rotating clockwise) are green and blue; and low pressure systems (rotating counter clockwise) are red or purple. In the southern hemisphere, the lows are shown by greens and blues, and the highs are shown by reds and purples.
Indian Ocean
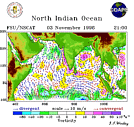
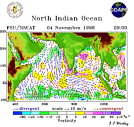
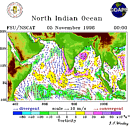
Three images from consecutive days are shown. One interesting feature is a storm in the Bay of Bengal. In the southwest corner, the winds are northward, showing the precursor to the winter monsoon season. Also apparent are the northern tips of two low pressure systems in the South Indian Ocean.
Pacific Ocean
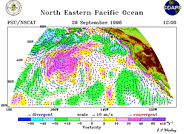
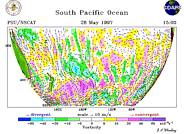
Examples of circulation patterns in the North and South Pacific Oceans. In the North Eastern Pacific, two features dominate the circulation: the Aleutian Low and the sub-tropical high off of California. South of the Bering Straight, there is also a strong high pressure system. In the South Pacific, a complex pattern of high and low pressure systems dominates the circulation. In the extreme South Pacific, the very strong winds around Antarctica are apparent.
Atlantic Ocean
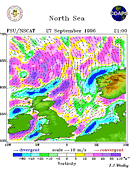
The relatively high resolution image of the North Sea shows the wind generated by a strong storm in the North Atlantic. Note the vorticity patterns generated from flow over and near to land.
Southern Ocean
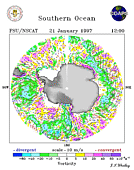
Note the small scale length for the 10 m/s scale: these winds are moving extremely fast. Three low pressure systems (light blue) are shown, with the largest to the West of Drake's Passage. There is strong outflow off Antarctica at 180 degrees longitude. The white areas off of the permanent ice sheet are temporary ice that is still present in the middle of the southern summer.

