Agulhas Current Configuration


AGULa0.4:
PDF version here
Resolution: 0.4º Mercator
Domain = [60ºW,120ºE,60ºS,0ºS];
Vertical discretization: 10 layers Full isopycnal
Stratification: Barotropic from 20ºC to 19.91ºC
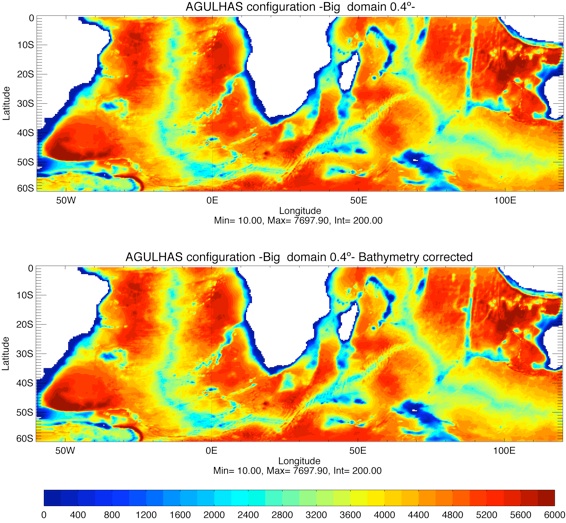
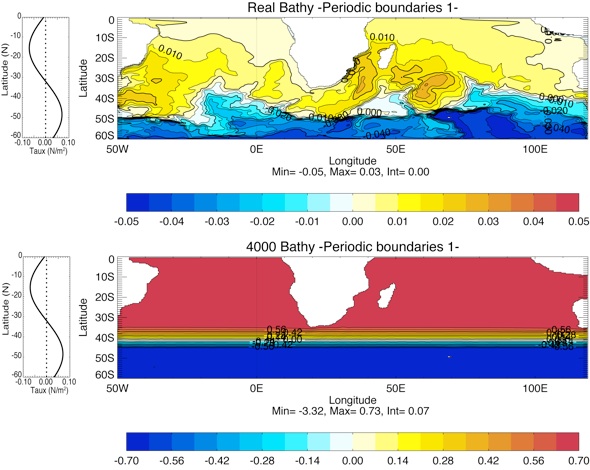
Fig. 1: Bathymetry extracted from 1/12º global configuration and interpolated on a 0.4º grid. Smoothing of the bathymetry on 10 points at the eastern and western boundary to assure periodic conditions.
Experimental Set-up
Expt_10.1:
Bathymetry: realistic from 1/12º global configuration
Boundary conditions: periodic, open at 60ºW from the Falklands (~52ºS) to 60ºS; idem at 120ºE.
Expt_10.2:
Bathymetry: 4000m Flat
Boundary conditions: periodic, open at 60ºW from the Falklands (~52ºS) to 60ºS; idem at 120ºE.
Expt_20.1:
Bathymetry: realistic from 1/12º global configuration
Boundary conditions: closed basin
Expt_20.2:
Bathymetry: 4000m Flat
Boundary conditions: closed basin
Expt_20.3:
Bathymetry: 2000m Flat
Boundary conditions: closed basin
Expt_20.4:
Bathymetry: 1000m Flat
Boundary conditions: closed basin
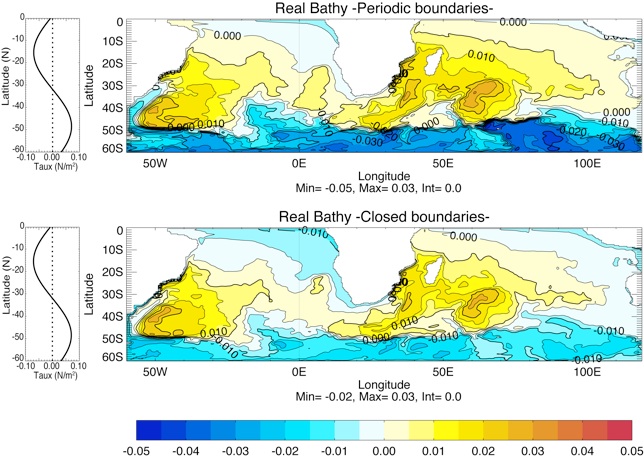
Fig. 2: SSH averaged over the 10 last days of a 1-year simulation for (top) expt_10.1, and (bottom) expt_20.1. Meridional Distribution of taux on the left.
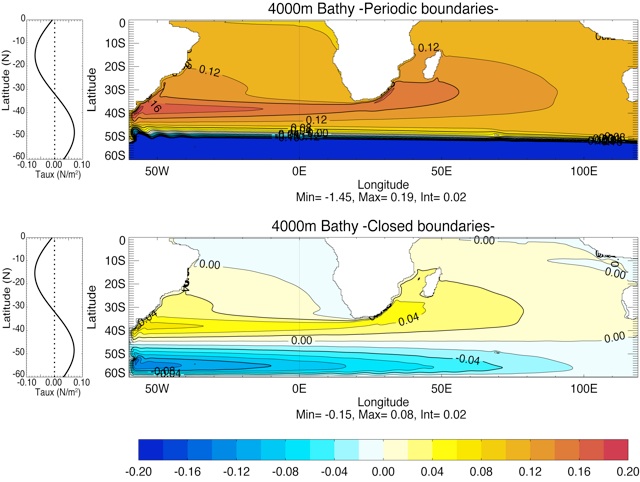
Fig. 3: SSH averaged over the 10 last days of a 1-year simulation for (top) expt_10.2, and (bottom) expt_20.2 with flat bottom at 4000m. Meridional Distribution of taux on the left.
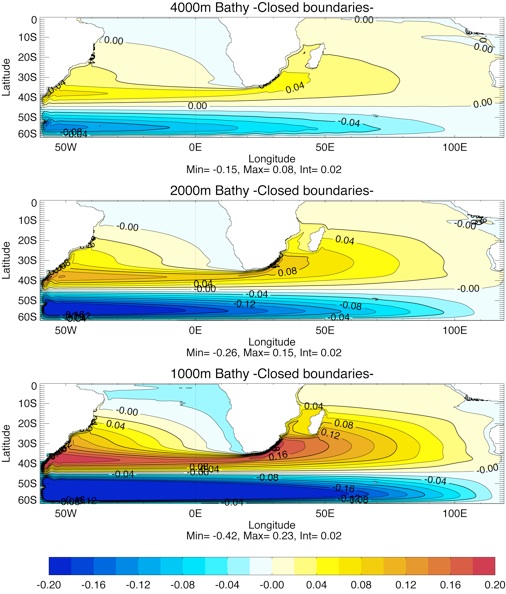
Fig. 4: SSH averaged over the 10 last days of a 1-year simulation for (top) expt_20.2 (4000m), (middle) expt_20.3 (2000m) and (bottom) expt_20.4 (1000m).
AGUL0.4:
Resolution: 0.4º Mercator
Domain = [50ºW,120ºE,60ºS,0ºS];
Vertical discretization: 10 layers Full isopycnal
Stratification: Barotropic from 20ºC to 19.91ºC
Experimental Set Up
Expt_12.3:
Bathymetry: realistic from 1/12º global configuration
Boundary conditions: periodic, open at 50ºW from 32ºS to 60ºS; idem at 120ºE (South of Australia).
Expt_12.4:
Bathymetry: 4000m flat bottom.
Boundary conditions: periodic, open at 50ºW from 32ºS to 60ºS; idem at 120ºE (South of Australia).
AGULa0.08:
Resolution: 0.08º Mercator
Domain = [60ºW,120ºE,60ºS,0ºS];
Vertical discretization: 10 layers Full isopycnal
Bathymetry: realistic from 1/12º global configuration
Boundary conditions: periodic, open at 60ºW from the Falklands (~52ºS) to 60ºS; idem at 120ºE.
Experimental Set Up
Expt_10.1:
Stratification: Barotropic from 20ºC to 19.91ºC
Expt_20.3:
Stratification: Baroclinic
Fig. 6: SSH averaged over the 6 days for (top) expt_10.1 (barotopic) and (bottom) expt_20.2 (baroclinic).
Animation of the SSH in the baroclinic experiment (20.3) from day 300 year 1 to day 16 year 2.
Expt_40.1:
Stratification: Baroclinic as expt_20.3 but with zero wind-curl at 44ºS instead of 49ºS as in NCEP.

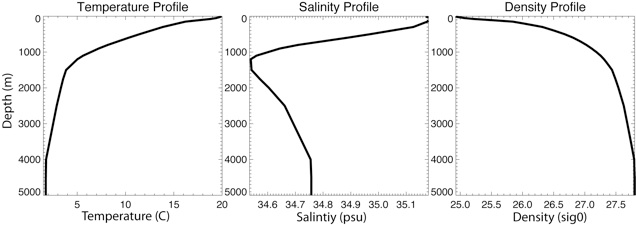
Fig. 5: T, S and density profile of the initial condition of expt_20.3.

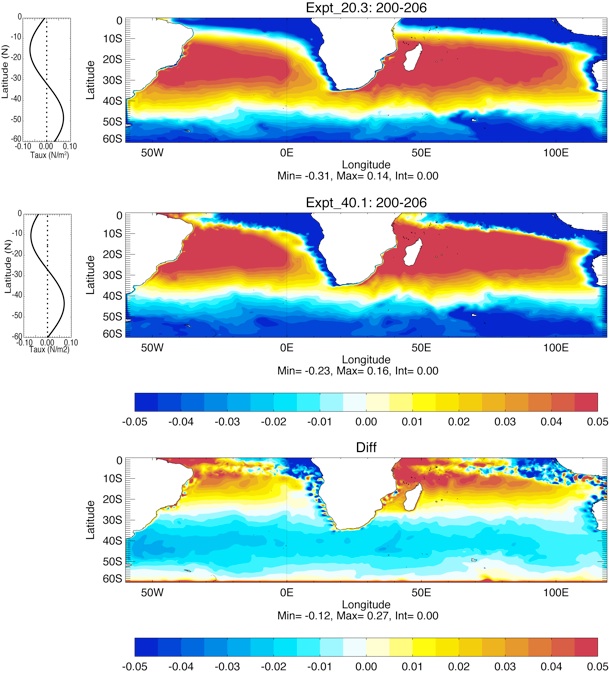
Fig. 7: SSH averaged over the 6 days for (top) expt_20.3 (zero wind-curl @ 49ºS), (middle) expt_40.1 (zero wind-curl @ 44ºS), and (bottom) their difference (40.1-20.3).
Animation of the SSH in expt_40.1 from day 300 year 1 to day 11 year 2.

Idealized experiment
We test the impact of the slant of the coast and the impact of the location of the wind-stress curl:
AGULa0.4
Resolution: 0.4º Mercator
Domain = [60ºW,120ºE,60ºS,0ºS] CLOSED;
Vertical discretization: 20 layers Full isopycnal
Stratification: Average stratification of around south Africa.
Bathymetry: flat at 4000m, no slip
Fig. 2: Test of impact of wind-stress curl at 44S with different coast angle (10º, 30º and 60º). Snapshot after 100 days.
Fig. 4: Test of impact of wind-stress curl at 23.5S with different coast angle (10º, 30º and 60º). Snapshot after 100 days.
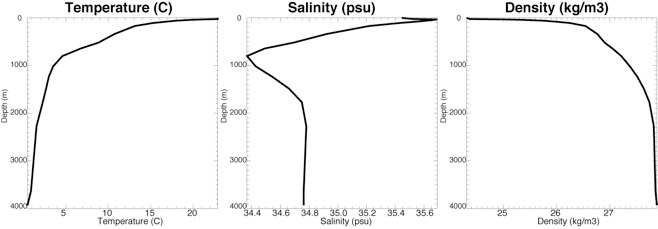
Fig. 1: T, S and density profile of the initial conditions
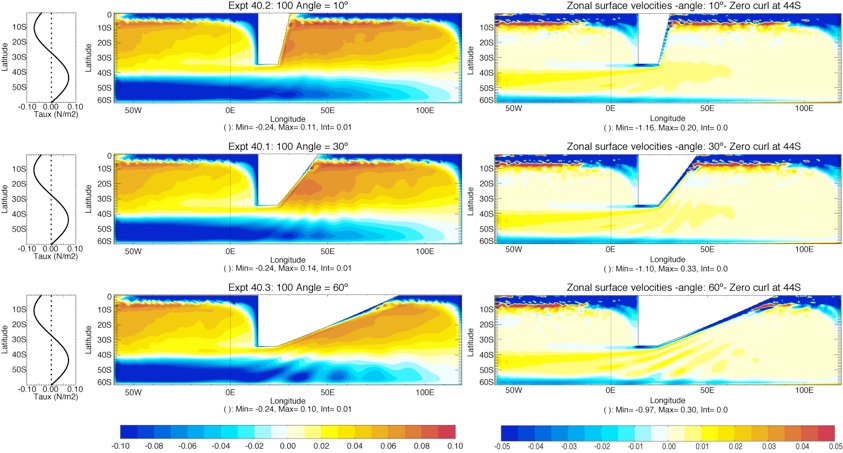
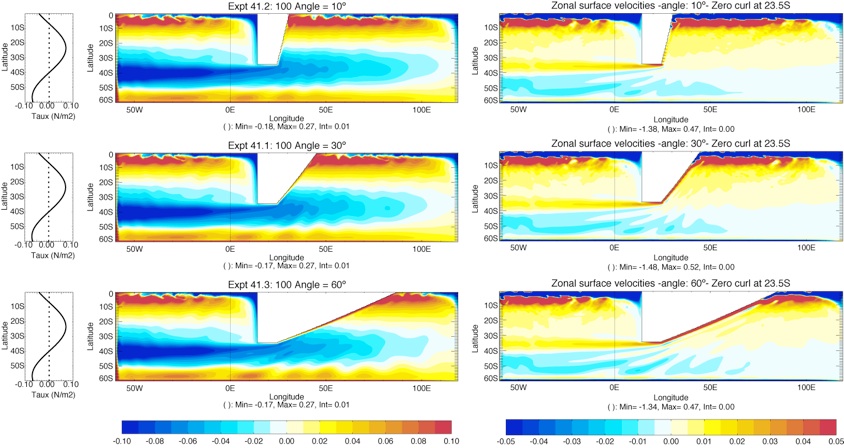
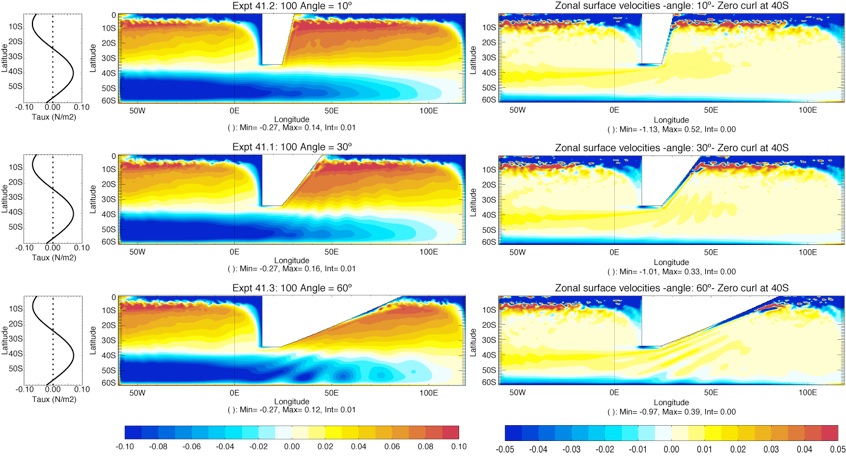
Fig. 3: Test of impact of wind-stress curl at 40S with different coast angle (10º, 30º and 60º). Snapshot after 100 days.
1. With Translated of the Wind-stress profile
2. With cubic spline Wind-stress profiles

Fig. 5: Test of impact of wind-stress curl at 45ºS with different coast angle (10º, 30º and 60º). Snapshot after 100 days. SSH on the left, Zonal velocity on the right (positive eastward)
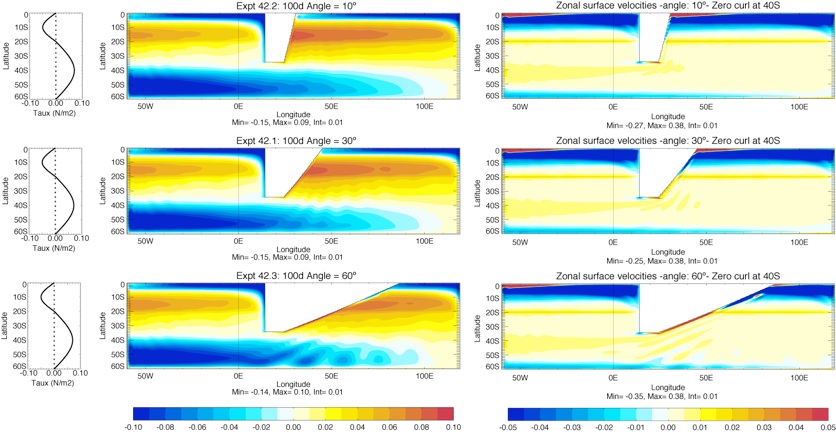
Fig. 6: Test of impact of wind-stress curl at 40ºS with different coast angle (10º, 30º and 60º). Snapshot after 100 days. SSH on the left, Zonal velocity on the right (positive eastward)
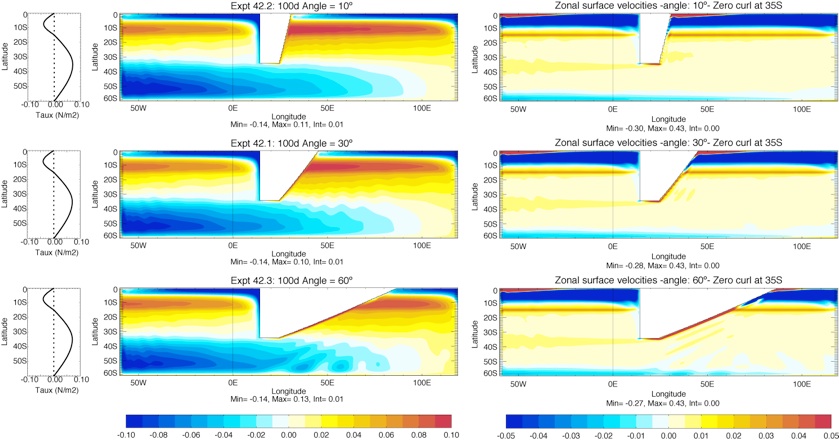
Fig. 7: Test of impact of wind-stress curl at 35ºS with different coast angle (10º, 30º and 60º). Snapshot after 100 days. SSH on the left, Zonal velocity on the right (positive eastward)
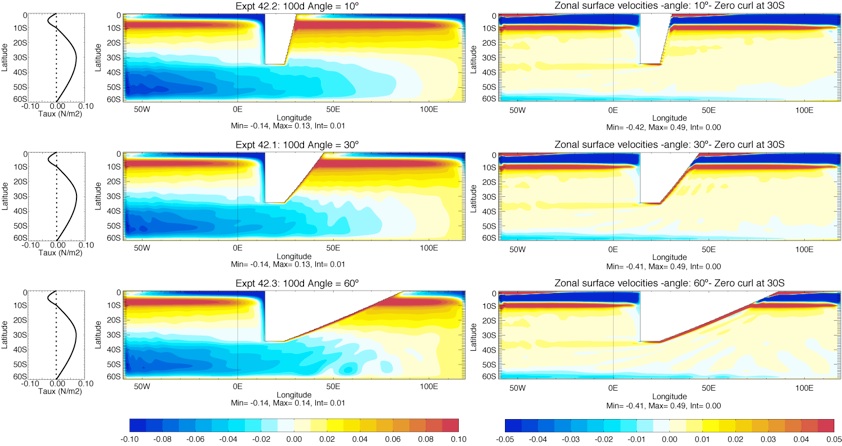
Fig. 8: Test of impact of wind-stress curl at 30ºS with different coast angle (10º, 30º and 60º). Snapshot after 100 days. SSH on the left, Zonal velocity on the right (positive eastward)
Zero wind-stress curl at 45ºS
Zero wind-stress curl at 40ºS
Zero wind-stress curl at 35ºS
Zero wind-stress curl at 30ºS