HYCOM GLBb0.08 in CESM
Global Diagnostics
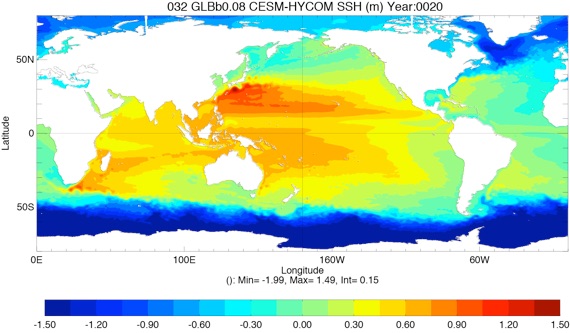
Fig 6: SSH average Year 10 and Year 20
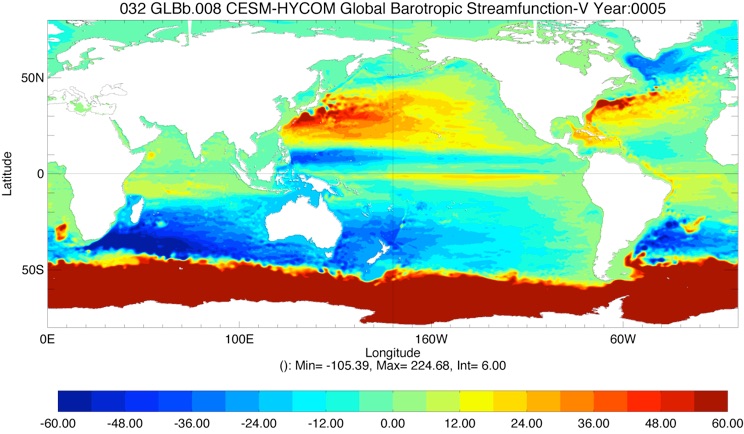
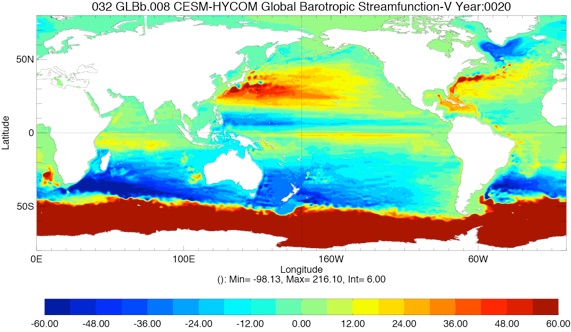
Fig 7: Barotropic Streamfunction for Year 10 and Year 20
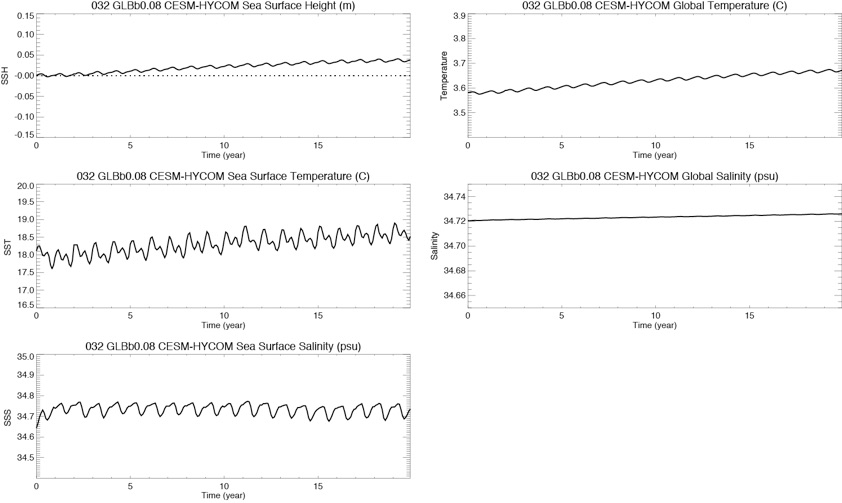
Fig1: Monthly time series of SSH (top,left), SST (middle left), SSS (bottom left) , global temperature (top right) and global salinity (middle right)
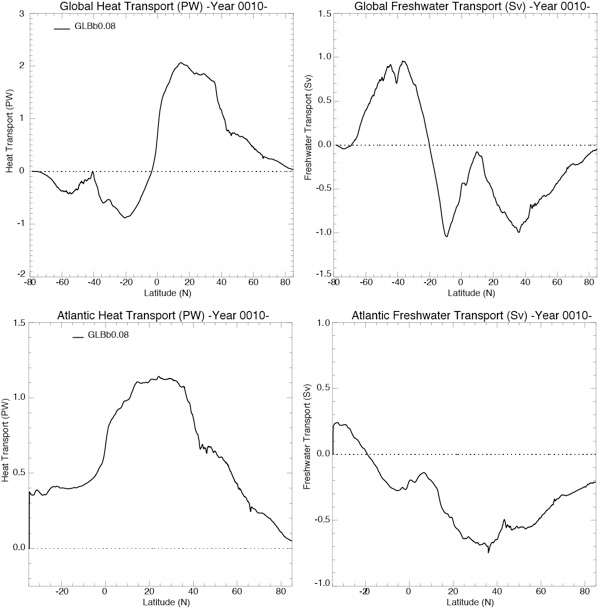
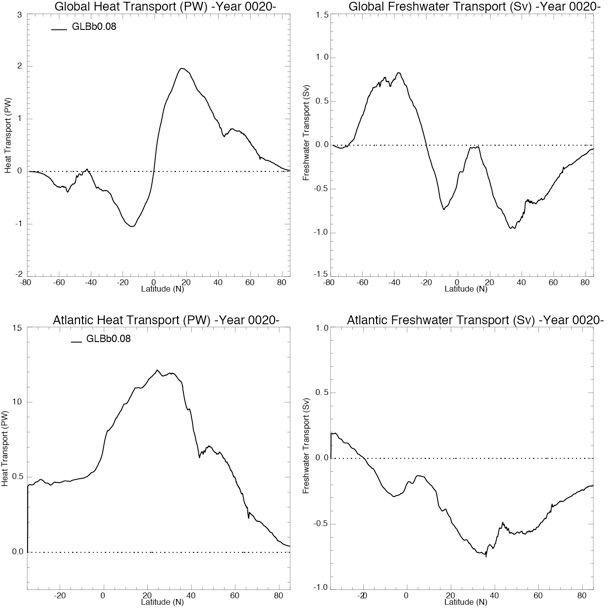
Fig 9: Heat (top) and freshwater (bottom) transport, global (left) and Atlantic (right) for Year 10 and Year 20.
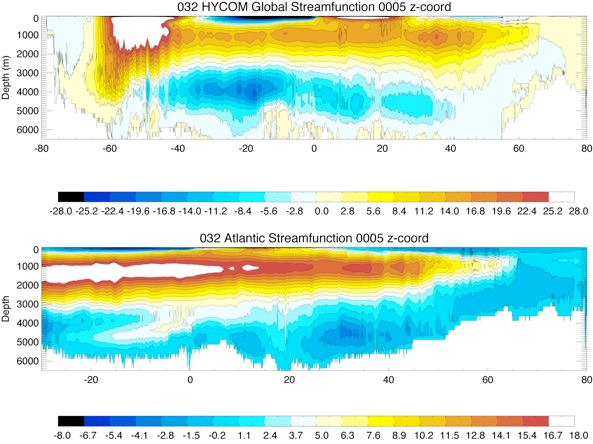
Fig 10: Vertical Streamfunction for the Global Ocean (top) and the Atlantic Ocean (bottom) for year 10 and year 20.
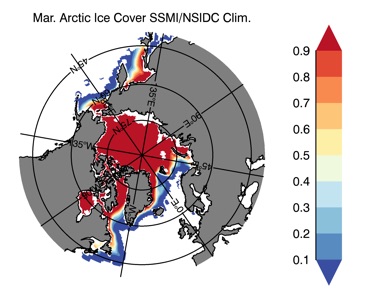
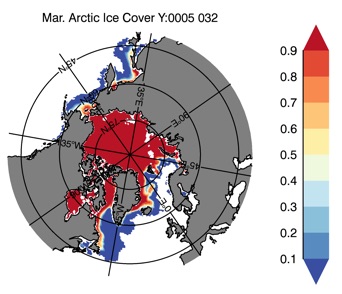
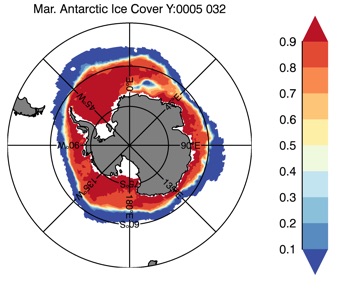
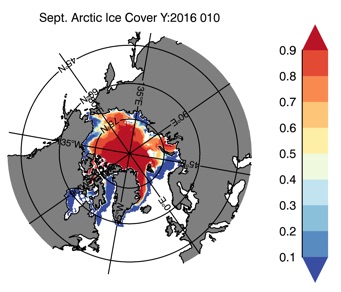
Fig 12: Ice cover in Winter Year 10 and Year 20 for the Arctic (top) and Antarctic (bottom). SSMI/NSIDC climatology (left) and HYCOM (right).
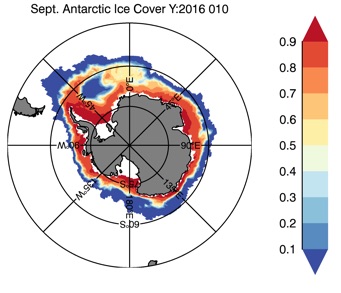
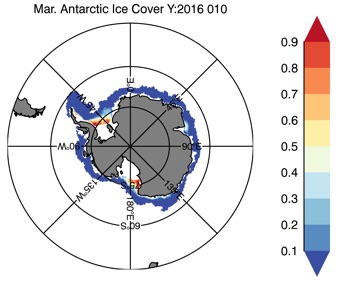
Fig 13: Ice cover in Summer Year 10 and Year 20 for the Arctic (top) and Antarctic (bottom). SSMI/NSIDC climatology (left) and HYCOM (right).
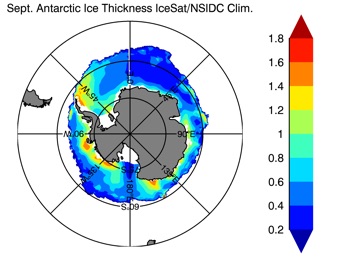
Fig 14: Ice thickness in Winter Year 10 and Year 20 for the Arctic (left) and Antarctic (right). IceSat/NSIDC climatology (left) and HYCOM (right).
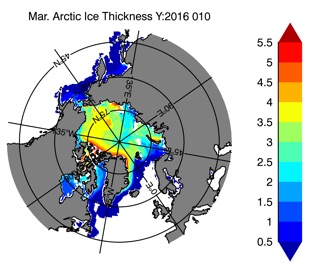
Fig 15: Ice thickness in Summer Year 10 and Year 20 for the Arctic (left) and Antarctic (right). IceSat/NSIDC climatology (left) and HYCOM (right).
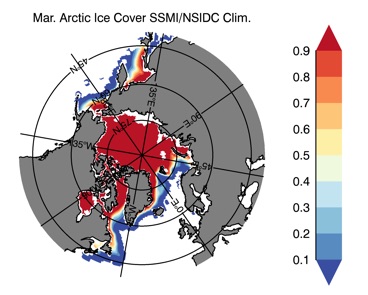

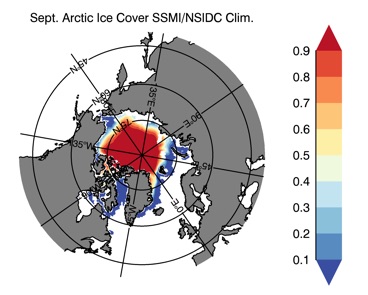
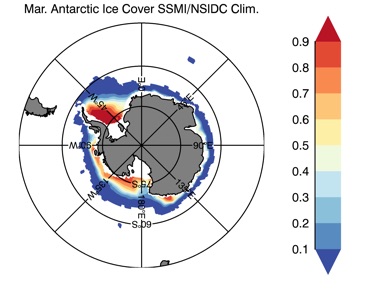
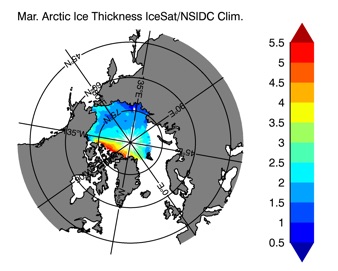
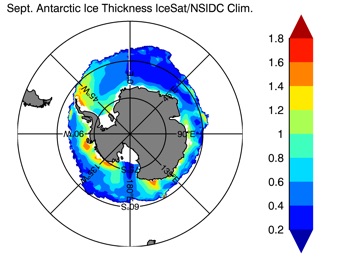
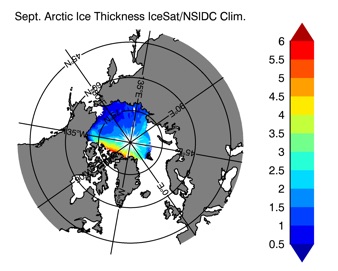
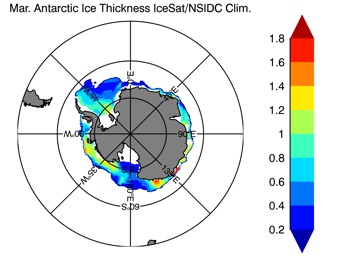
Fig 8: Drake Passage Transport (Sv), Florida Strait Transport , Bering Strait Transport, Indonesian Transport.
HYCOM GLBb0.08 in ESPC
Comparison of T,S, SST,SSS and SSH for ESPC-HYCOM vs. CESM-HYCOM from year 1 to 5
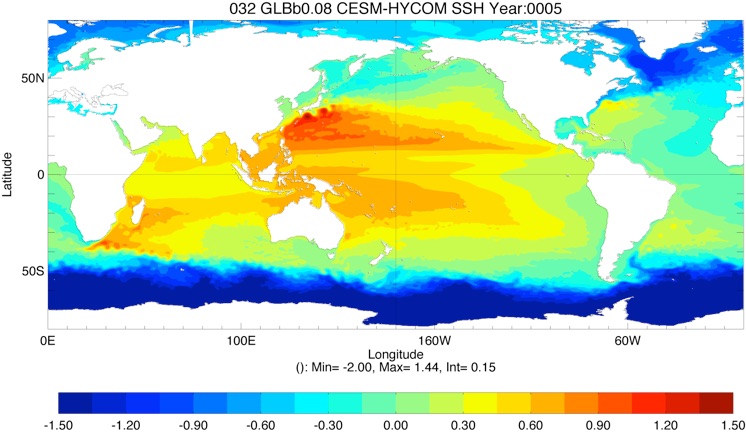
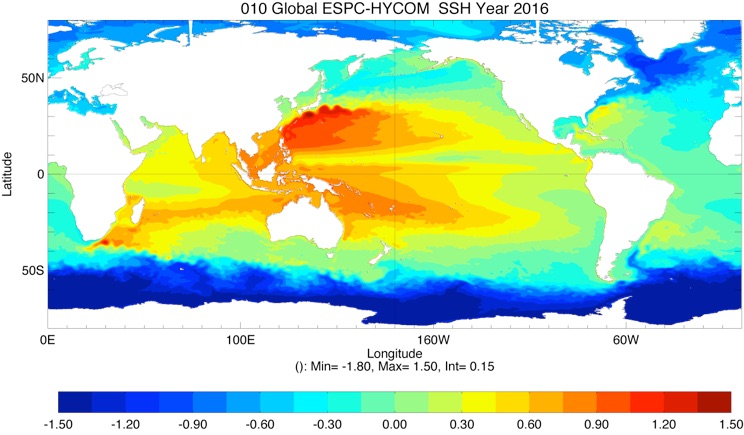
SSH CESM-HYCOM Year 5
SSH ESPC-HYCOM Year 5
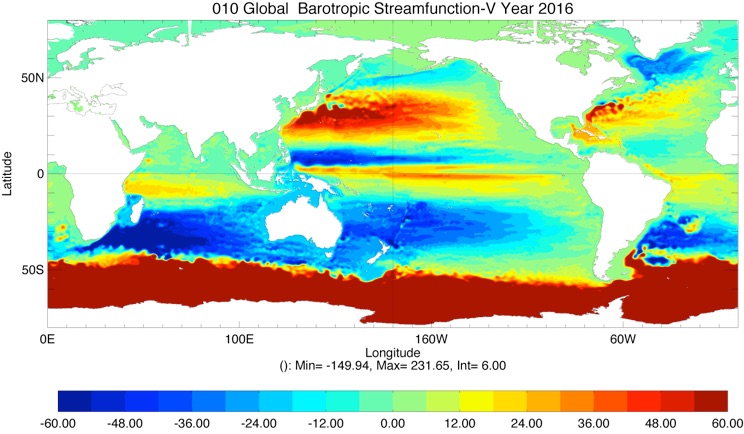
BSF CESM-HYCOM Year 5
BSF ESPC-HYCOM Year 5
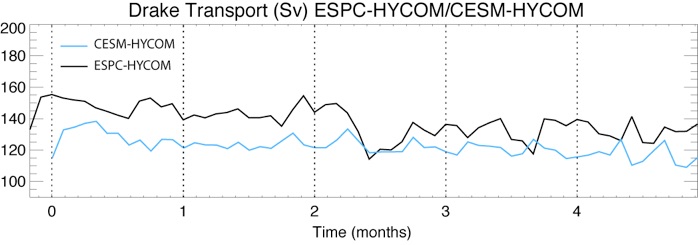
Drake Transport ESPC-HYCOM vs. CESM-HYCOM
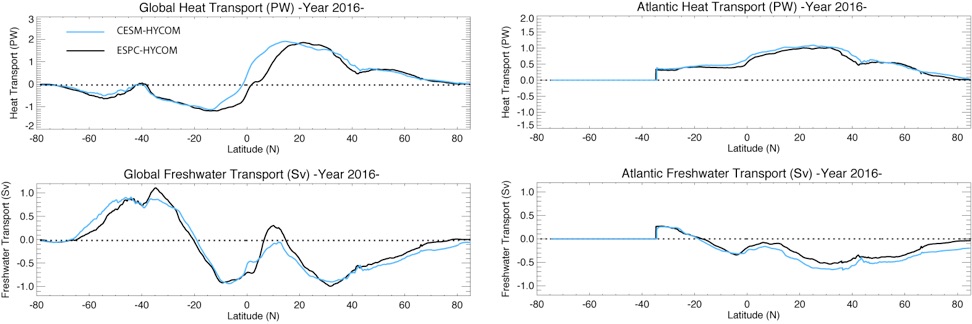
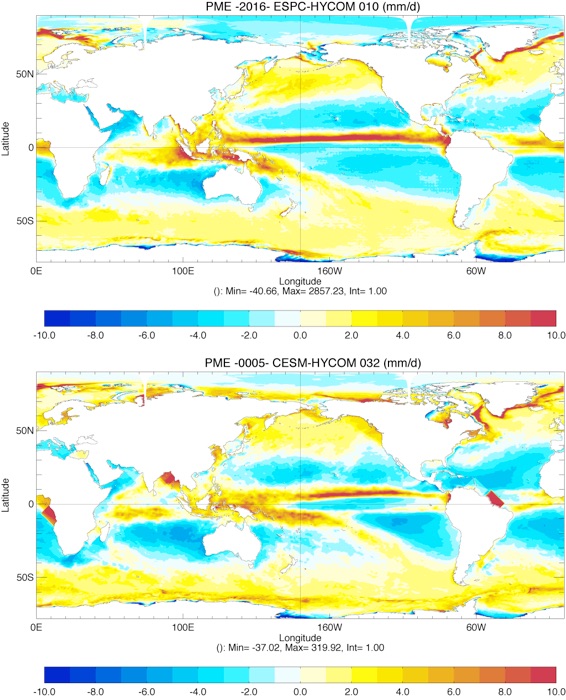
Global and Atlantic Heat/Freshwater transport Year 5
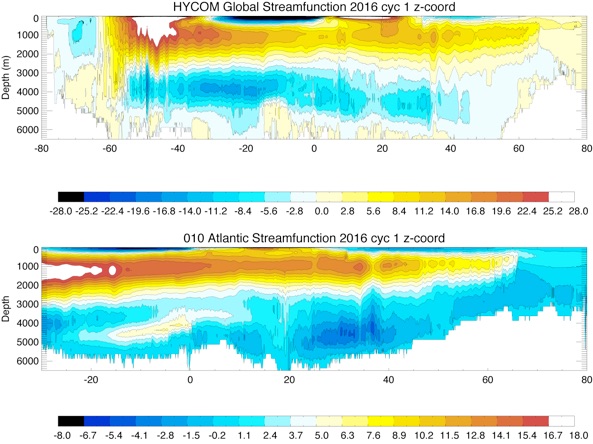
Vertical Streamfunction
CESM-HYCOM Year 5
Vertical Streamfunction
ESPC-HYCOM Year 5
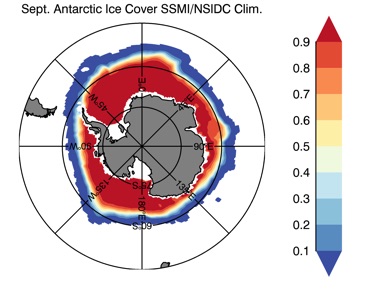
ESPC-HYCOM Year 5
CESM-HYCOM Year 5
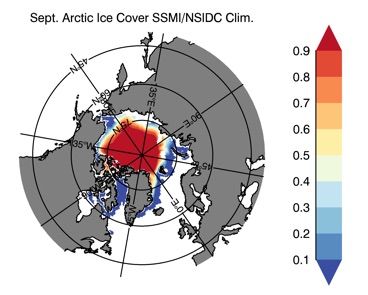
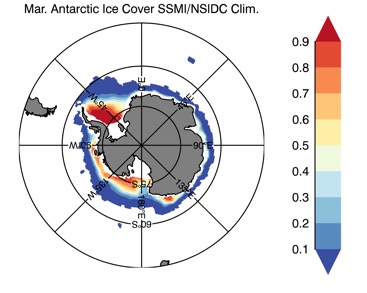
ESPC-HYCOM Year 5
CESM-HYCOM Year 5
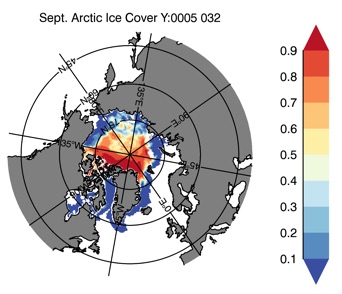
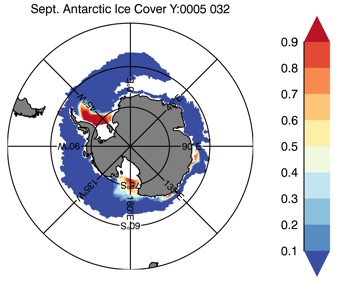
Ice Cover Summer
Ice Cover Winter
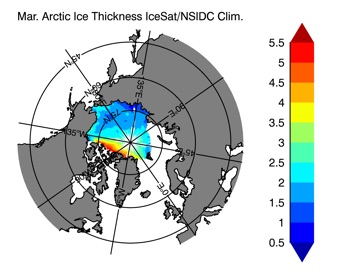
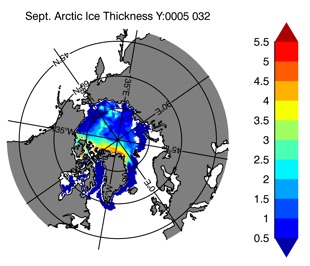
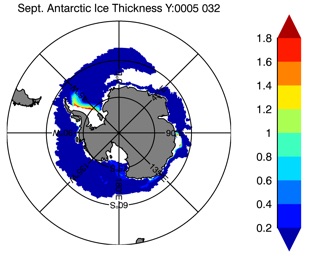
ESPC-HYCOM Year 5
CESM-HYCOM Year 5
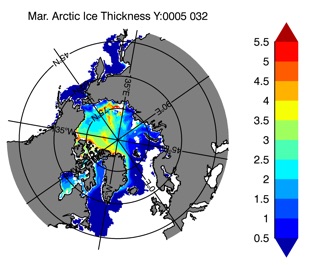
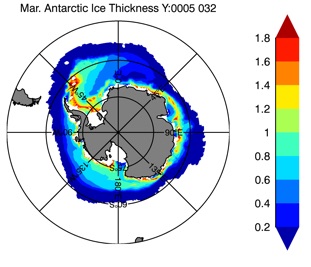
Ice Thickness Winter
ESPC-HYCOM Year 5
CESM-HYCOM Year 5
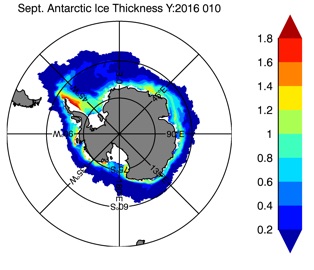
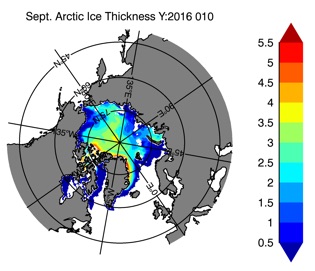
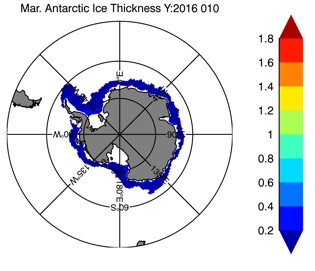
Ice Thickness Summer

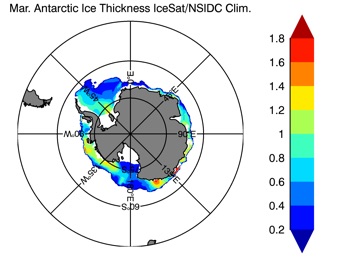
Fig 11: Time series of the maximum streamfunction at 26.5ºN, 41.5ºN and 45ºN.
Differences between ESPC and CESM:
-
-Quadratic Bottom Friction : cb=1.e-3 in EPSC / cb=2.e-3 in CESM
-
-Biharmonic velocity diffusion : veldf4 = 0.01 near Antarctic Coastal Area and 0.02 everywhere else in ESPC / veldf4=0.02 everywhere in CESM
-
-hybrid coordinates relaxation time: hybrlx=8. in ESPC / hybrlx=16. in CESM ( With a hybrlx closer to 0., the coordinates are more isopycnals than hybrids/z-coord)
-
-Kara Bulk Formulation in ESPC / Large and Yeager Formulation in CESM
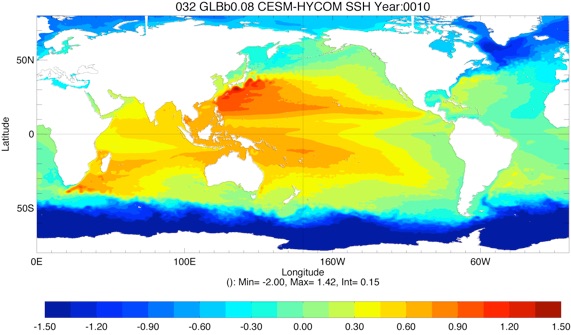
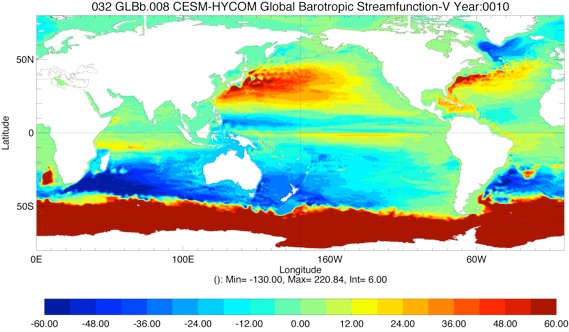
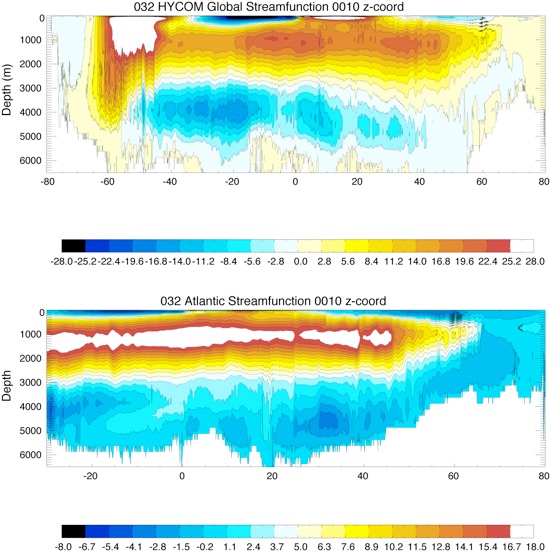

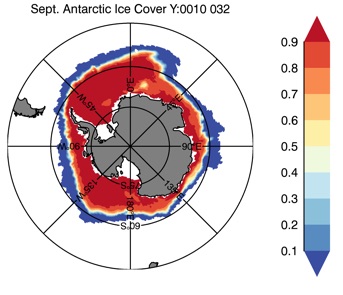
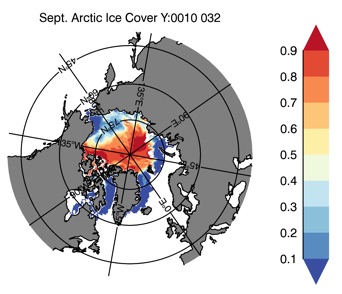
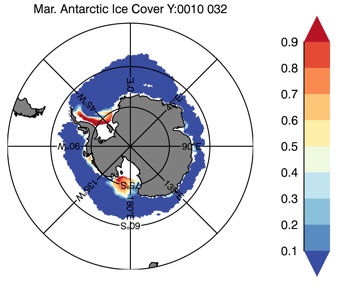
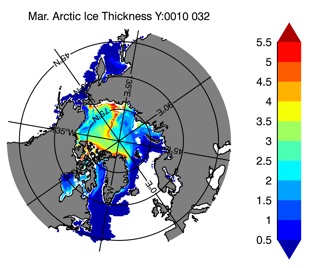

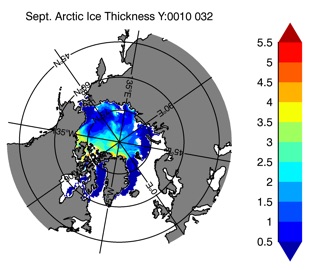
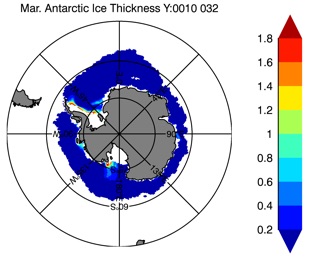
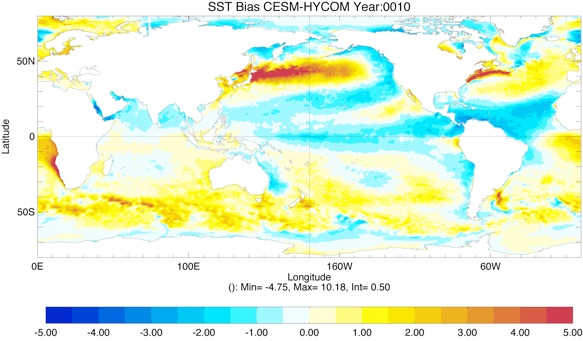
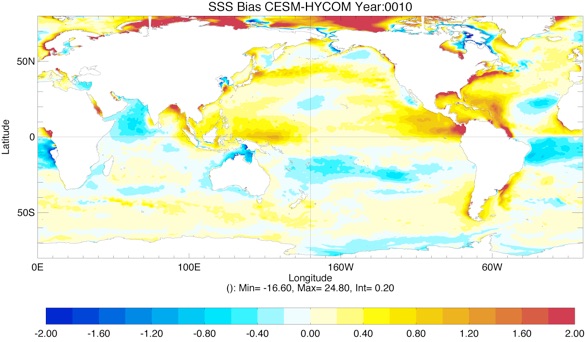
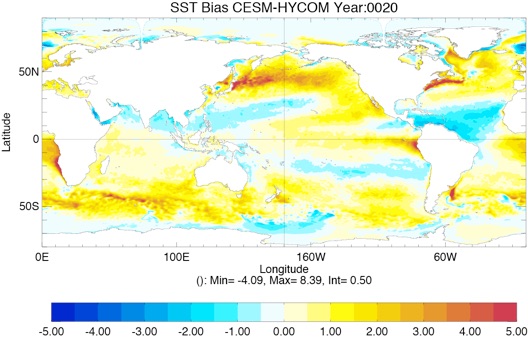
Fig 2: Yearly SST Bias from GDEM4 climatology for Year 10 and Year 20
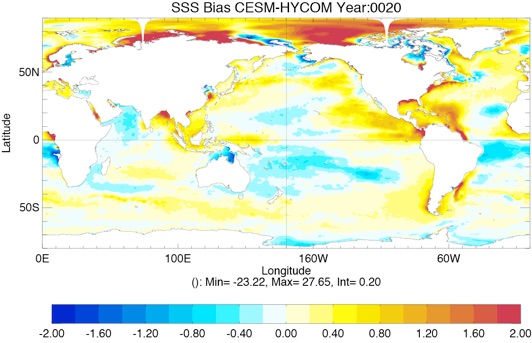
Fig 3: Yearly SSS Bias from GDEM4 climatology for Year 10 and Year 20
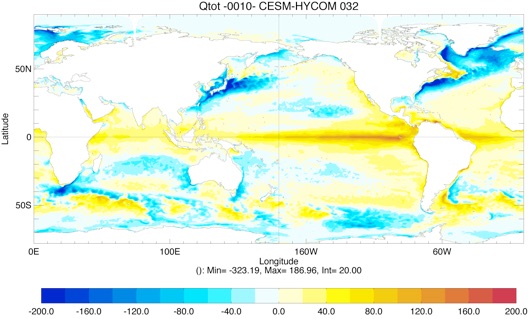
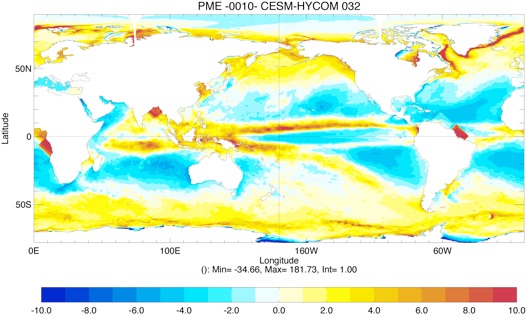
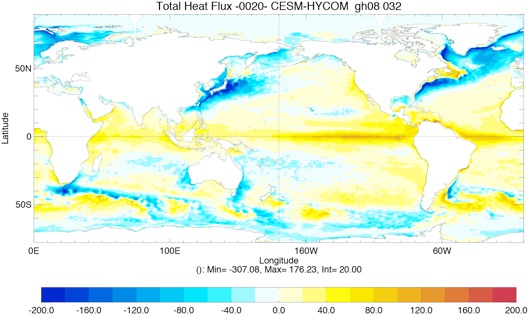
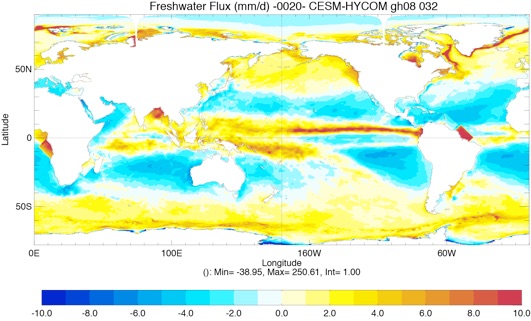
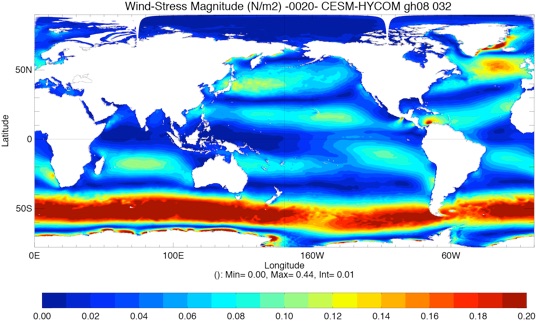
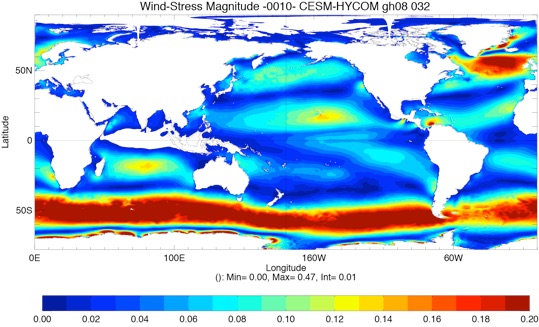
Fig 4: Yearly total heat flux (W/m2, top left), total precipitation minus evaporation (PME mm/day, top right) and wind stress (N/m2, bottom left) for Year 10 and Year 20.
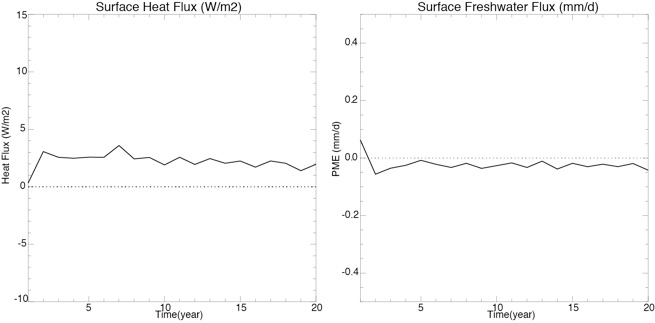
Fig 5: Time series of the global surface heat flux (left) and freshwater flux (right).
Sept.
Mar.
Sept.
Mar.

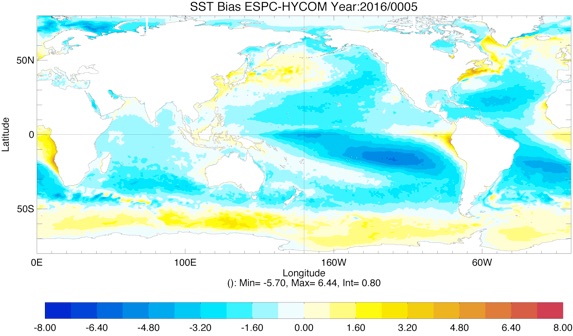
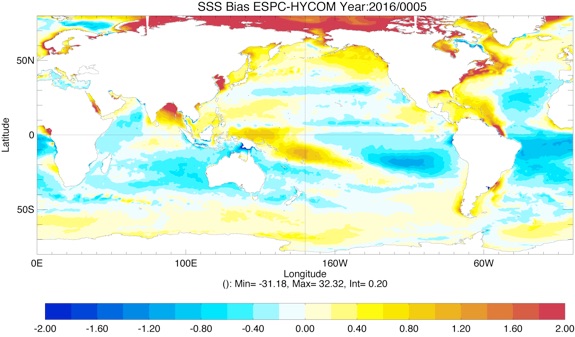

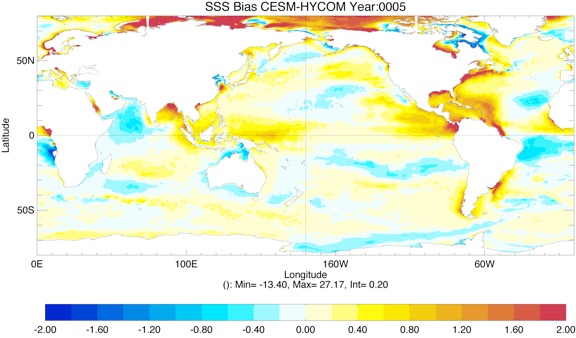
Comparison of SST and SSS biases for ESPC-HYCOM vs. CESM-HYCOM from year 1 to 5
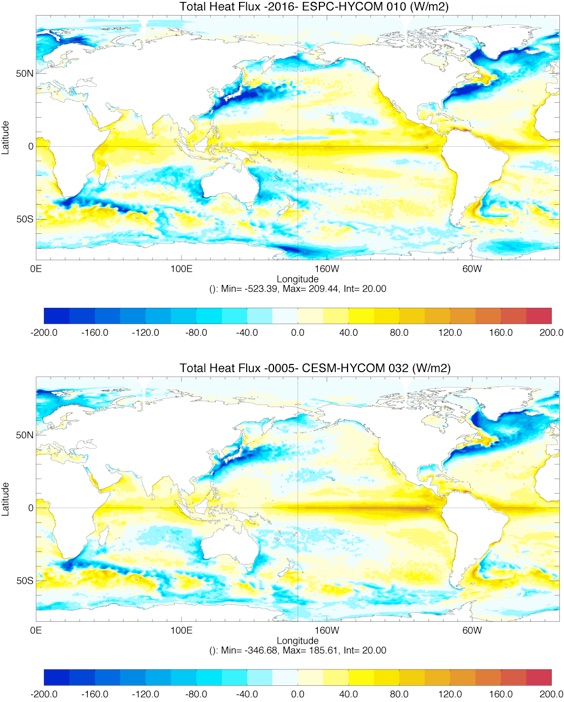
Comparison of Total surface Heat Flux Year 0005
Comparison of total Freshwater Flux Year 0005

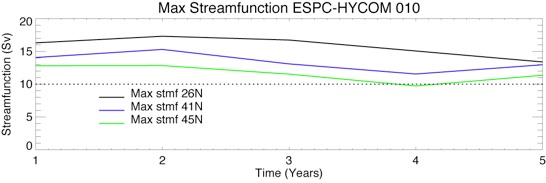

Time series of Maximum Streamfunction at 26N, 41N and 45N for ESPC (top) and CESM (top)
HYCOM in ESPC GLBb0.08 vs. GLBt0.72: see here
Year 10
Year 20

Year 10
Year 20

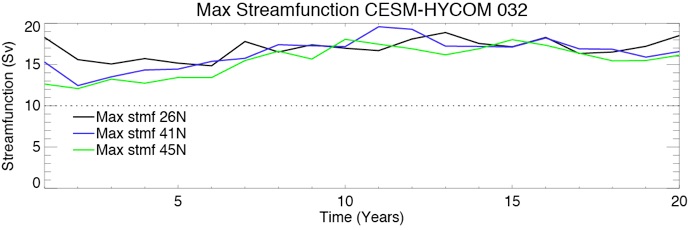

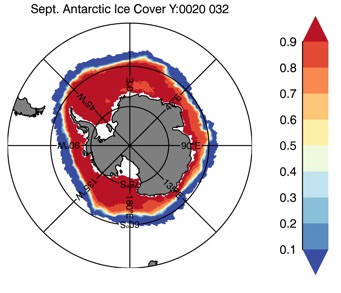
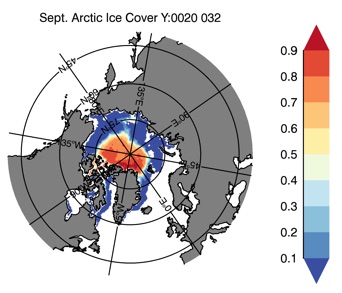
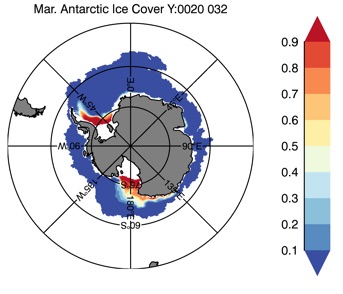
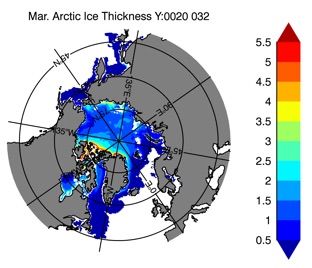
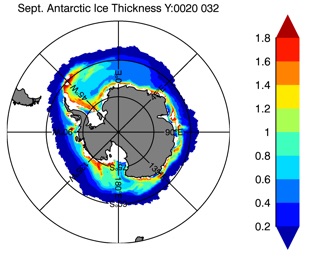
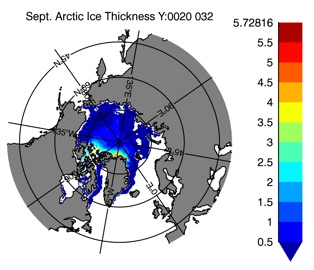
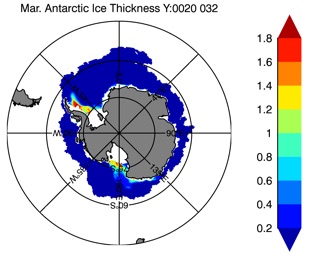

Table 1: Drake Passage Transport (Sv), Florida Strait Transport , Bering Strait Transport, Indonesian Transport averaged over years 15 to 20.