

Case Study: Turtle Mound
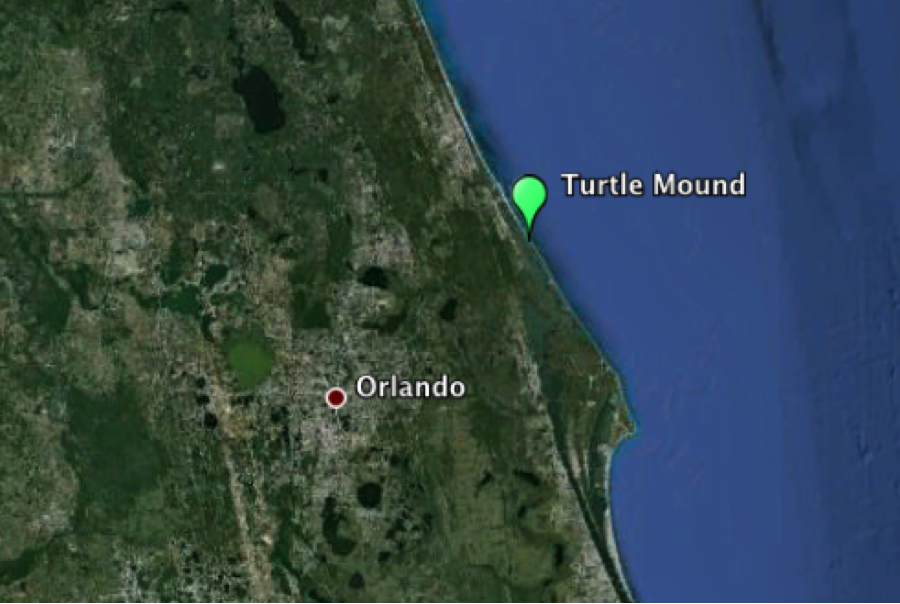
Map displaying location of Turtle Mound
Turtle Mound is a shell mound located in Canaveral National Seashore. The shell mound is constructed of oyster shells, fish bones, and other refuse that prehistoric Indians discarded over time and used to build the mound. Given the mound's organic composition, the mound is extremely vulnerable to erosion. Factors that can accelerate the mound's erosion are rising sea level, increased precipitation, and hurricanes (characterized by storm surge, heavy precipitation, strong winds). This section focuses on data that can be used to quantify erosion risks for the shell mound island, as well as other standard climatological variables.
The climate normals[1] (below) for the Daytona Beach International Airport daily station exhibits a steady increase in precipitation since 1961, although this increase appears to be part of a decadal precipitation cycle. Periods of high precipitation will increase the erosion risk for Turtle Mound. While temperature might not directly affect the shell mound, it is an indicator of climate change. Temperature does not appear to be changing significantly, which suggests climate change is not obvious for the region.
Closest daily station to Turtle Mound: Daytona Beach Intl AP(ID:012834/082158)
Climate Normals:
| 1961–1990 | 1971–2000 | 1981–2010 | |
|---|---|---|---|
| Temperature | 70.4°F | 71.0°F | 70.9°F |
| Precipitation | 47.89 in. | 49.29 in. | 49.62 in. |
Drought Index (PDSI) for Climate Division 3 (1895-Current):
https://www.ncdc.noaa.gov/temp-and-precip/time-series/index.php?parameter=pdsi&month=1&year=2012&filter=p12&state=8&div=3
Although precipitation is increasing, there seems to be no clear response from the drought index to show the increased precipitation. This can be due to one of two reasons. Either the precipitation is concentrated in a wet spell, which does not affect PDSI very much, or other factors, such as evapotranspiration, recharge, runoff, etc., compensate for the increased precipitation. From 1895 to 1998, it is unlikely that drought affected Turtle Mound because the PSDI values have not been extreme and dry periods have been mixed with periods of surplus moisture. Since 1999, there seems to be a prolonged drought. The duration of the drought might dry out the organic composition of the shell mound and make it more brittle and susceptible to erosion.
In addition to atmospheric influences on Turtle Mound, changes in the ocean may also impact the shell mound. Since hurricanes bring long durations of rainfall, storm surge, and increased wind speeds, hurricanes pose a significant erosion threat to the shell mound. As major hurricanes are more intense and typically result in higher storm surge than occurs with weaker hurricanes, they pose a greater risk for erosion. The first table (below) lists the climatological probability of a hurricane landfall in the vicinity of Turtle Mound. This method of calculating probability does not take into account future climate change or sea level rise. The method only considers the mean number of hurricanes from 1944 to the present and determines landfall probabilities. To further quantify the erosion threat, storm surge maps are available for the region from NOAA's SLOSH storm surge model. This model determines how much storm surge would occur in a region on the basis of hurricane category. According to the maps, Turtle Mound is in a region that is very susceptible to storm surge, and the mound sits at an elevation of ~1 m. Since Turtle Mound has such a low elevation and is very susceptible to storm surge, a rising mean sea level would increase the risk of erosion during a future hurricane.
Annual Climatological Landfall Probability of Hurricane:
| 1 or more | 2 or more | 3 or more | |
|---|---|---|---|
| Hurricane (Cat. 1 and up) | 0.375 | 0.081 | 0.012 |
| Major (Cat. 3 and up) | 0.137 | 0.010 | 0.0005 |
Storm Surge Maps (2011):
http://www.wunderground.com/hurricane/FlAtlCoastSurge.asp
A note on future sea level changes:
Sea level changes are significant to the shell mound sites because of the erosion threat. Two reliable ways to forecast future sea level changes are using a persistence forecast and using a numerical model. A persistent forecast assumes that conditions don't vary much within a given time span. In this case, a persistence forecast assumes that sea level continues to rise/sink at the same rate it has been for the duration of the observational period. Using the rate of mean sea level rise recorded from a buoy (1928-2006), mean sea level at Turtle Mound will continue to rise 2.40 mm/year every year. At this rate, by the year 2100, the sea level will have risen by 26.4 cm at Turtle Mound. Many meteorologists believe the causes for rising sea level (melting ice, rising SST, etc) are not going to remain constant. In this case a persistent forecast would be less accurate. Dr. Gary Mitchum produced a sea level report that predicted sea level changes using a numerical model for the southeastern U.S. He used global sea level predictions from the 2007 IPCC report as a good approximation for changing sea level for the southeastern U.S., despite sea level in the southeastern U.S. rising 20% more than global levels. Also, Mitchum accounted for Antarctica ice melting more than predicted in the IPCC 2007 report. The Mitchum report concluded the most likely scenario is an increase of 80 cm by the year 2100; however, Mitchum's confidence in the forecast is low because of uncertainty in the 2007 IPCC models.
[1] A climate normal is defined as a 30-year average, with procedures in place (probabilities, standard deviations) to deal with missing or suspect data values. Source: http://www.ncdc.noaa.gov/land-based-station-data/climate-normals/1981-2010-normals-data